Friday, December 27, 2024

Nautical charts - how the most important navigational aid is created

For centuries, paper nautical charts were the only way to visualise your own position
Photo: iStock; sb-borg
 
From Yacht by Nils Theurer
 
To this day, the nautical chart is the most important means of navigation.
We provide insights into the fine art of early cartography


At the time the keel of every classic yacht was laid and for many decades afterwards, the nautical chart was the be-all and end-all of safe navigation.
This is often no longer the case in the 21st century.
On some ships that have been faithfully restored to their original condition, a modern plotter has long shimmered coyly below deck, competing with the paraffin lamp.
Even in the past, hardly anyone thought about the production of charts.
And even today, their existence, whether in printed or electronic form, is taken for granted by many.
 
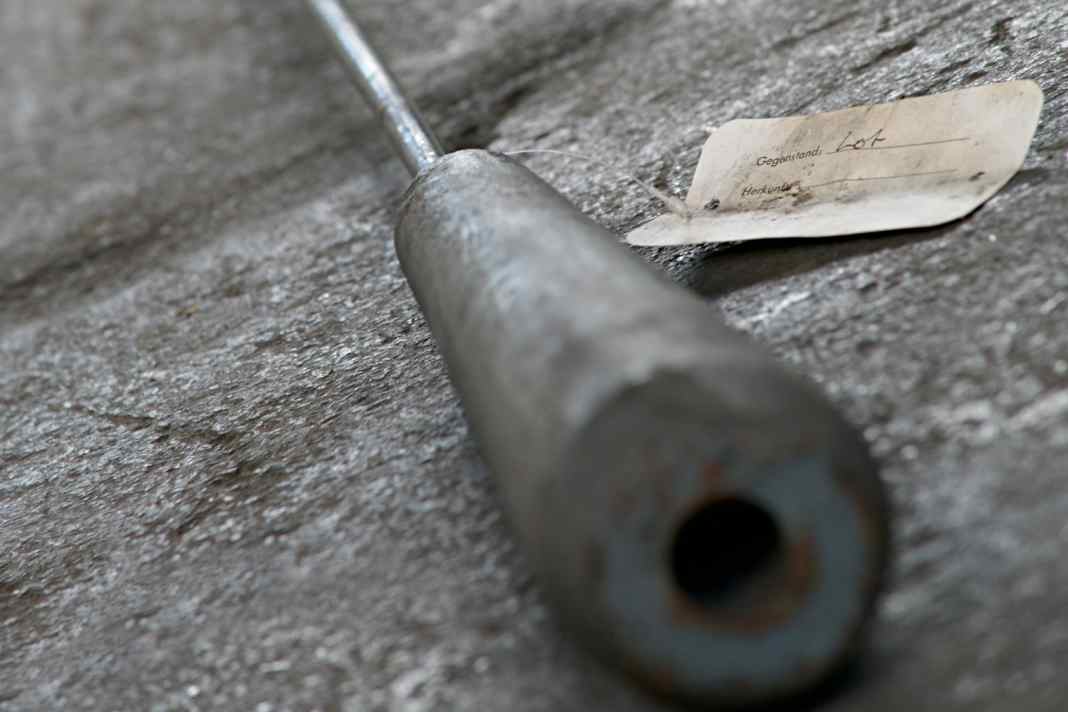
Heavy plumb weight for taking measurements at great depths.
Discovered in Shed 50 of the Hamburg Harbour Museum
photo Niels Theurer

For a long time, capturing information about water depths, coastlines and much more on paper was a laborious and time-consuming process - even though it did not require any sophisticated technical equipment.
On the contrary, meticulous manual labour was required for most of the work steps.
Up until the 1950s, nautical charts were produced on the basis of filigree copper engravings.
It was not until the second half of the last century that the layer engraving process became established, allowing for rapid chart production.
The Federal Maritime and Hydrographic Agency (BSH) continued to use it until a few years ago - when the digital revolution also took hold in the world of charts.
A look back in history illustrates the importance that has always been attached to the exact documentation and processing of nautical data.

 
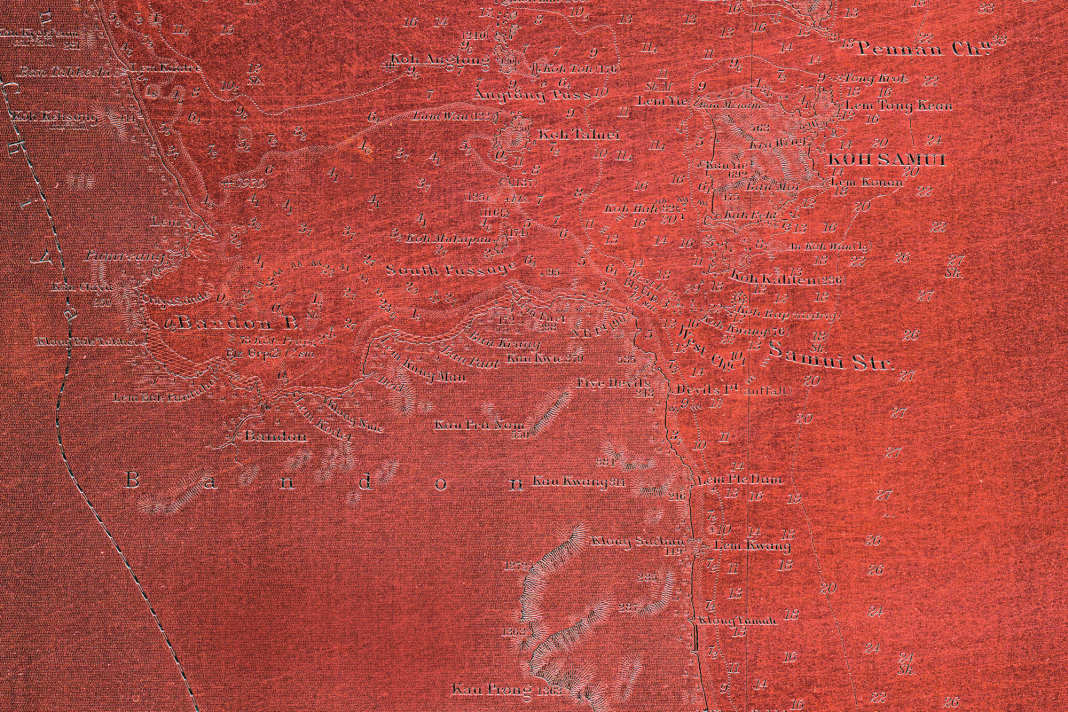
A good 100-year-old copper plate with a section of a nautical chart of the Gulf of Thailand.
Until the development of layered engraving, engravers always had to work upside down.
For better legibility, the photo is mirrored here 
photo FVM
 
The principle of producing nautical charts

The principle of producing nautical charts has always been quite simple: when sailing the area, the depth is plumbed as often as possible, the depth is entered on a white chart, the result is neatly drawn again on land, reproduced and sold for a profit.
However, there is one problem with this procedure: where exactly does the depth figure belong on the white sheet?


Engraver Daniel Janssen, bent over his workpiece, which is placed on a round plate.
In this way, the copper plate to be worked on can be quickly turned in all directions
photo Niels Theurer 
 
If the coast is still visible and the associated land has already been reliably surveyed, the surveyors are in luck - they can copy the coastal chart onto the white sheet at exactly the same scale.
Two lackeys on sounding sextants, let's call them protractors, now sing out their degree numbers for each plumbed depth, assuming good visibility and little swell.
Using the trick of cutting backwards and thanks to a marker with an angle ruler above the still empty chart, every depth can then be entered with pinpoint accuracy.
Theoretically.
In practice, the current water level still needs to be added to the plumb depth.
This cannot be determined at sea.
So someone on land has to take notes at the water level.


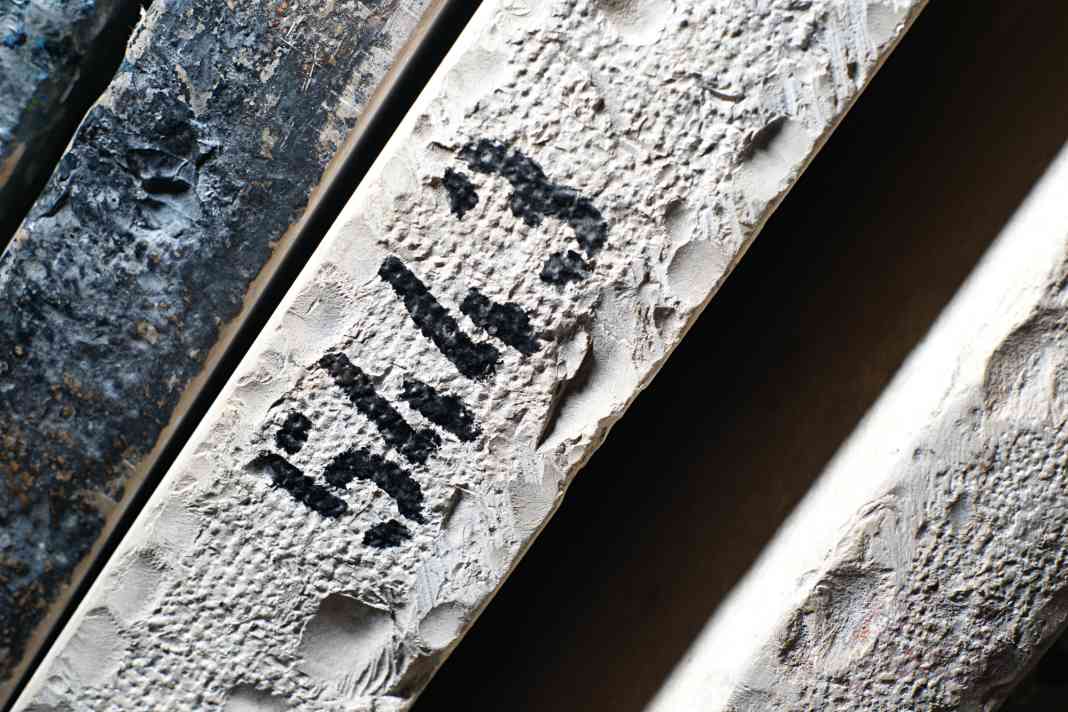
The back of a printing plate made from Solnhofen limestone slate.
The limestone was intended to replace the copper used until then, as it did not flatten as quickly and therefore allowed a higher print run.
However, it hardly allowed any corrections to be made afterwards.
And the stone plates weighed 350 kilograms
photo Niels Theurer

While the men take bearings with poles at shallow depths of up to around four metres, they then use hand-held sounding devices.
Provided the upper arms are strong enough, up to six measurements per minute are possible.
The deeper it gets, the less speed the sounding boat is allowed to make.
From a depth of twelve metres, however, this method also fails.
The surveyor will now stop the boat for each measuring point and take individual soundings using the hand winch and a heavy weight.
Depths of up to around 200 metres are surveyed in this way.
Beyond that, motorised winches are used later.

In an essay from 1879, published in the "Deutsche Rundschau für Geographie und Statistik" (German Review of Geography and Statistics), we read: "To give an idea of the awe that must be shown when casting and hauling in a 100-fathom-long deep-sea plumb line, let us take a look at the sounding of the Bay of Biscay for hydrographic purposes in the 19th century.
There, the sinker took 33.5 minutes to reach the bottom at a depth of 4456 metres, and a twelve-horsepower steam winch took around four hours to pull it back up." 
 

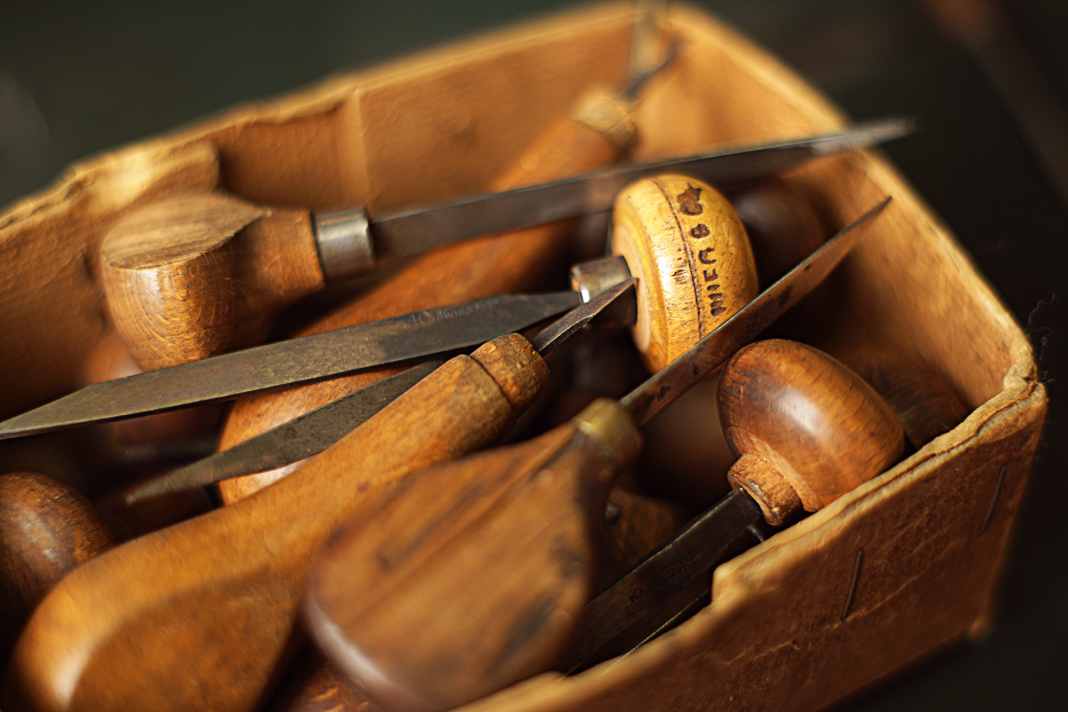
Gravers, which simply means steel, in various thicknesses and designs. In earlier times, engravers usually worked with tools specially adapted to the length of their hand, often up to 50 of them
Photo: Nils Theurer

Valuable knowledge

Understandably, the measurements beyond the continental shelf were rather sparse.
Eleven to thirteen crew members were the norm on a sounding boat at the time.
This labour-intensive effort to obtain usable data already suggests that the resulting maps were later sold like gold leaf.


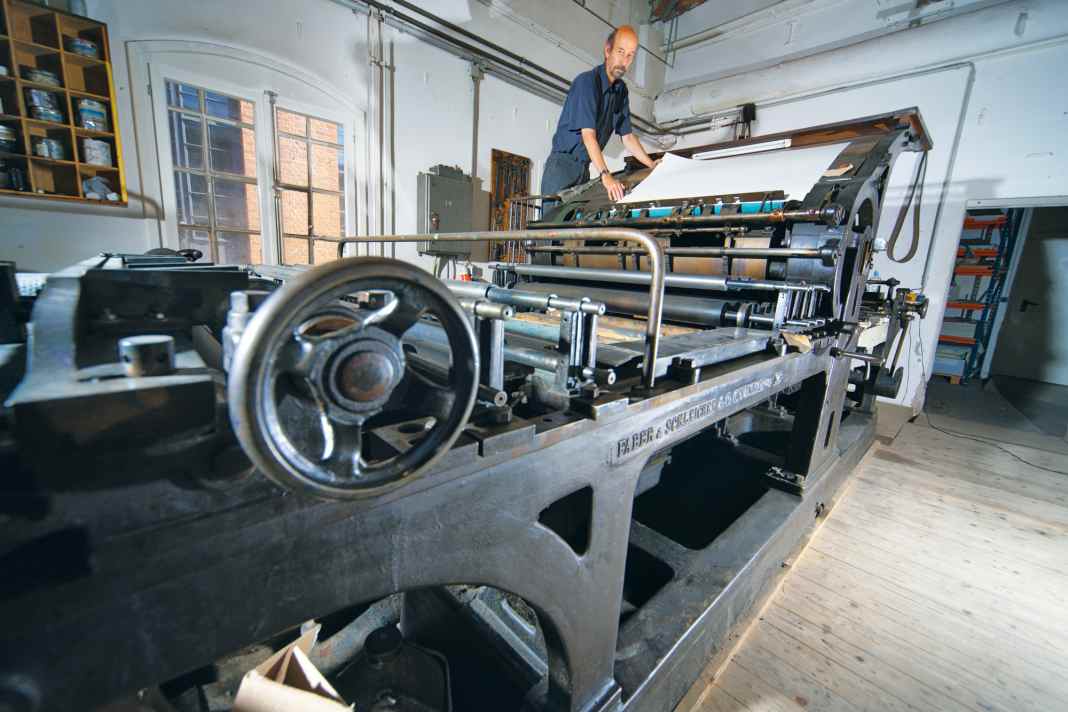
 A high-speed lithographic press from Faber & Schleicher.
The printing forme is moved continuously under a cylinder.
Feeding the sheets of paper requires a skilful hand
Photo: Nils Theurer

But they are not yet printed.
The end result, which was displayed on the chart table in classic yachts, was not only the product of very complex measurements.
It also represented one of the greatest challenges for the then still young art of printing.
In this context, the copper plate as the basis for printing was already a major advance.
In the 16th century, printing was still done using the letterpress process on artistically carved wooden plates, known as woodblock printing.
Only later blacks were allowed to remain.
With copperplate engraving, however, the white areas could remain untreated.
Instead, the black lines were scratched into the material after printing, known as drypoint etching.


With a steady hand and a sharp stylus, the cartographer works on the red-coated film where depth or coastlines are to be marked later on
Photo: Nils Theurer

If tiny copper grooves were also created with a burin, these later produced a high-contrast, sharp and even slightly tactile line when printed.

Daniel Janssen, one of today's rare engravers - the correct name for copperplate engravers - demonstrates the process on a palm-sized showpiece in Hamburg's Museum der Arbeit.
The labour-intensive procedure begins with the preparation of the gravers.
"It was not uncommon for a single engraver to use 50 of them.
They were precisely matched to the length of his hand," explains Janssen.
"Special steel punches were also used for numbers or wreck symbols." The engraver not only has to excavate all the lines precisely and to the same depth, but he also has to cut them back.
This is because he can only drive the graver into the copper at the start of a line with a gradient.
To ensure a clean start to the line, each channel is therefore excavated again from the other side to the end.


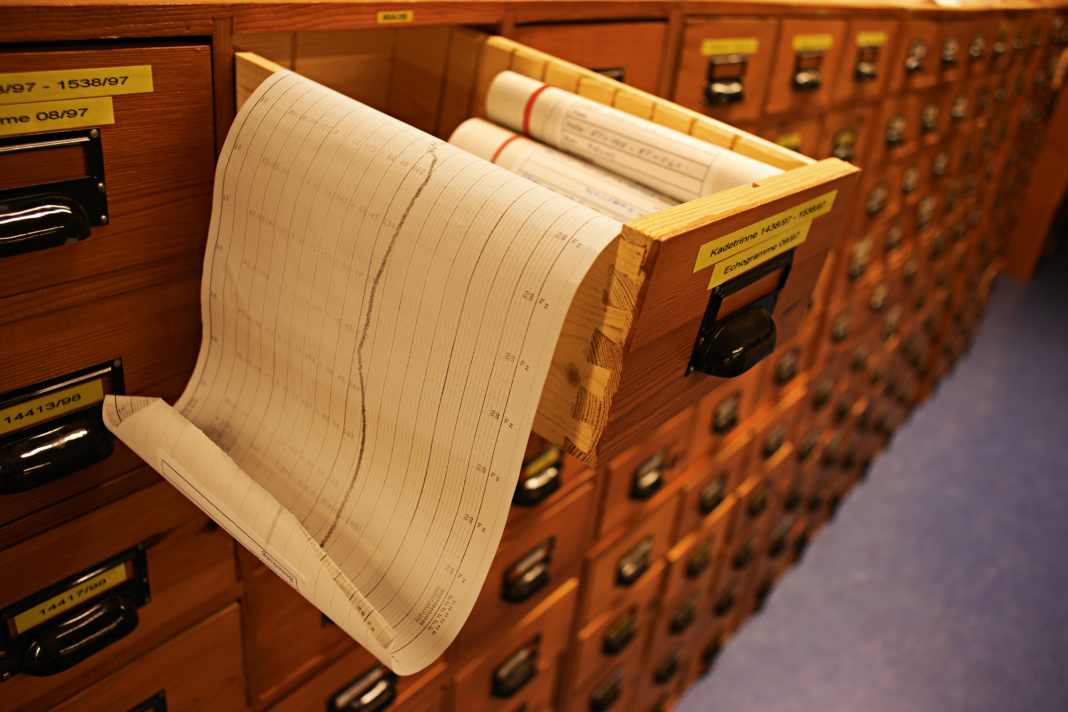
Sounding rolls, the so-called echograms, for the Kadet Channel/Baltic Sea in the archive of the Federal Maritime and Hydrographic Agency in Hamburg
Photo: Nils Theurer

"The engravers therefore use a ball on which they can turn their engraving piece back and forth," says Janssen.
It is hardly surprising that the engraving of land and sea maps was not exactly popular with the craftsmen, as the large printing plates could not be turned very quickly.
The engravers therefore resorted to a trick: first, as many lines as possible were started in one direction and then engraved back en masse after one rotation of the plate.
As if that wasn't enough, the fact that the printing process required mirror-image work made things even more difficult.
Janssen: "It was not unusual for it to take four years of training to become a skilled engraver."


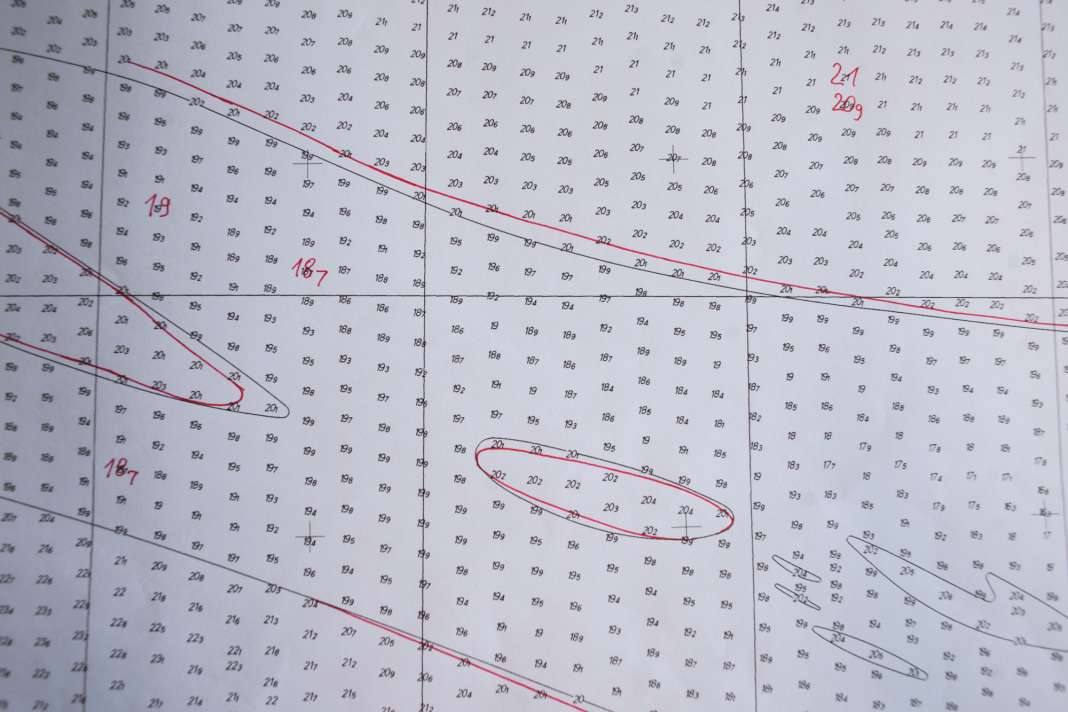
The soundings have been transferred point by point to a map and edited (red markings).
Photo: Nils Theurer

In a race against time

While maps of an entire country were already a colossal task for the engravers and surveyors, the creation of nautical charts also meant working against the clock.
Not even in Prussia in 1861, not only does the seabed, unlike any visible hill on land, refuse to be directly surveyed, it is also constantly changing.
For this reason, the "sailing instructions" and "sea manuals" have as long a tradition as the charts themselves: These were used to swiftly publish what had changed.
After surveying, it took a good six months for a new nautical chart to be drawn on cardboard from the soundings obtained.
The engraver then bent over a single copper printing plate for a whole year! 
Then came the actual printing, which was also time-consuming, followed by the distribution of the maps.


Every change in the map is documented on the continuation sheet.
Photo: Nils Theurer

In short, if the entire coastal area of a country was to appear on nautical charts, this was a matter of national importance.
This was also recognised in 1861, or rather only in Prussia.
They were a little late in realising this.
Spain, the USA, Russia, Portugal and Belgium had already had printed charts since 1800.
Prussia's "Sea Atlas" from 1841 already existed at the time and was even considered to be quite accurate.
However, the surveyors had only rowed one and a half to three kilometres out to sea with small open boats and mirror sextants and had determined the depths there with sounding rods and plumb bobs.
They had not ventured any further off the coast.


For engraving, cartographers have various special tools at their disposal to carve information and markings into the film coating
Photo: Nils Theurer

The state surveying offices

The BSH, today's successor to the Hydrographic Bureau, currently has around 800 employees.
It started 151 years ago with a single chief cartographer and two draughtsmen.
It took six years for the first map to be published.
In the meantime, the coasts of the incorporated states of Schleswig-Holstein and Hanover fell to Prussia, which increased the tasks.
Nevertheless, by 1882, 21 years after the bureau was founded, 44 maps of the Baltic Sea, Belts, Sound and North Sea had been published.
In 1893, the cartographic staff was increased to nine men, and in 1896 to eleven.
At this time, surveys were also carried out off West Africa.
This resulted in nine maps.
The Bismarck Archipelago was also mapped, as was Kaiser Wilhelm Land, resulting in eight charts.
Finally, the sea off German East Africa was documented in 14 charts.
By 1899, 220 nautical charts had been produced - a remarkable achievement.


The tweezers are used to add tonnes and other information, which are applied to transparent films, to the card.
Photo: Nils Theurer

Admiral von Tirpitz, State Secretary in the Reich Navy Office, introduced a bill in the Reichstag the following year in which he called for the further expansion of the German nautical chart system to include non-domestic waters.
The German colonies were still considered the home coast.
Two years later, the Reichstag approved two million marks for this task; a trained bricklayer earned 40 marks a week at the time.
Spatial expansion was a major issue, and few were afraid of war.


Magnifying glass, knife, pen, ink: tools for map tracking
Photo: Nils Theurer

In 1903, Erskine Childers wrote "The Riddle of the Sandbank", the first ever spy novel.
It was a cry for help from the author out of desperate political conviction: The book was intended to prevent a raid from the German mudflats.
It later turned out that it was actually planned.
Not as a direct consequence of this, but with the same mindset, around 2,400 maps of the entire world were to be produced within 50 years from 1908 - a task to which all seafaring nations dedicated themselves simultaneously.
And it was by no means a division of labour.
In times of impending crisis, nobody wanted to be dependent on the enemy's maps, which were quickly withdrawn in the event of war.
The engravers - several engraving workshops were now employed - had full order books.
By the First World War, 664 charts had been published; by the end of the Second World War, they totalled 1050.
60 Karto copper engravers were now working exclusively on German nautical charts in various companies.


Coastal details: Sounding marks as a navigational aid for the navigators, to be seen on a nautical chart for the Rostock area, published by the Reichsmarineamt in 1904

From relief to gravure to flat printing

However, the increasing print runs and the incredibly fast engraving times presented the printers with a dilemma: the copper plates became flatter with each print, and the indentations were soon flattened by the printing presses.
Only around 50 to 100 sharp prints are usually possible from a copper plate.
Not enough.

As early as 1870, attempts were made to draw the maps directly on the more stable Solnhofen limestone slate, a particularly fine stone from a former limestone sediment that was only available in a Bavarian quarry.
Thus, nautical chart printing conquered new territory.
Flat printing was suddenly the order of the day rather than relief or intaglio printing.
But this process also had its disadvantages: Not only did the nautical chart-sized plates weigh 350 kilograms each, the result was also too flat compared to the prints that people were used to from copperplate engravings.
In addition, correcting the stone plates was only possible with great effort.
And copying onto galvanoplastics did not produce the desired sharpness at the edges either.
The brilliant British nautical charts were always regarded as the measure of all things.


Swedish map, made by Gustav von Klint in 1815, with degree grid and ray lines
Photo: Nils Theurer

Consequently, the plates were engraved in copper again.
If corrections were necessary, the plates were initially knocked flat again from behind.
This was not easy, as the correct position first had to be transferred from the front.
Later, new copper was therefore applied to the front for corrections using galvanic processes.
This was followed by surface grinding and re-piercing.
Despite making the work easier, it was still a mammoth task.


Map of the Curonian Spit, published in "Preussens See-Atlas" in 1841, with first depth information
Photo: Nils Theurer

And there were other problems to overcome: The intaglio printing process with copperplate engraving works best with paper that is highly absorbent.
Nautical charts, on the other hand, should be printed on paper that is as waterproof as possible.
And they should be able to withstand many erasures of the places and courses entered in pencil.
So we were forced to look for compromises.


Map of the German Hydrographic Institute from 1915 with numerous depths far off the lagoon coast
Photo: Nils Theurer

After the Second World War, layer engraving became practicable, both at the then German Hydrographic Institute (DHI) and at the GDR's Maritime Hydrographic Service (SHD).
The new process saved a great deal of time and replaced the Karto copper engravers.


Nautical chart from 1972 in current edition of 2012 with reduced representation of depths and coastline
Photo: Nils Theurer
 
ENC LT660710 Seaport of Klaipeda (scale 1/80000 ed28 update : 20241115)

From negative to positive

Janet Gudusch from BSH takes another look at her "elephants" and "engraving rings" - delicate gravers for sparkling clean lines.
They continue to populate her workplace.
Not just out of nostalgia, they still work perfectly today.
The narrowest ones have a sapphire tip that is sharpened to a hundredth of a millimetre.
The coating process is reminiscent of scraping finger paint off a window pane, only much smoother.
The technical cartographer uses the engraving tools to carve coasts, roads and bridges into a transparent red coating of dimensionally stable film, creating a negative image.
At the end of a working day, she has removed a thimbleful of coating in the form of extremely fine lines.
A special copying process produces a positive copy of this negative, on which everything that was previously removed appears in rich black.
Tones, depths and lettering are then added to this copy.
This means sticking tiny, self-adhesive films in the right place using a cutter and tweezers.

A separate foil was produced for each of the up to ten colours.
This made printing tedious, as each sheet of card had to run through the same offset printing press ten times and the card had to be set up anew each time.
But ten colours was something you could only dream of in the days of copperplate engraving.
What's more, it was now relatively easy to make corrections with pen and ink on the transparencies.
In addition, technical cartographers were finally able to work in the correct orientation.
 

The portolan map from 1550 by Batista Agnese shows the western Mediterranean region.
The radial networks and the many place names along the coasts are typical.
Photo: FVM

While even an experienced printer still needed around ten minutes per print from a copper plate, much higher throughputs were now possible.
The printing presses usually ran for a whole day for each special nautical chart colour and were then washed.
Then a day on the next colour, and so on.
For the last two years, however, production has only been using four-colour offset printing.
The sheets run through the four process colour units cyan, magenta, yellow and black in one go.
The aluminium printing plate, formerly the annual work of a copperplate engraver, is spit out and developed by the digital printer within a few minutes.
It costs 15 euros per colour.

Less is more

Sea charts with numerous depths once boasted that the area was well surveyed.
White spots were regarded as uninvestigated.
Today's editorial work, on the other hand, means almost radical omission.
While the individual soundings on sounding routes were still easy to trace on the first maps, with the advent of echographs there was suddenly an oversupply of data that the surveyors delivered to the map editors.
In the case of charts, highly generalised and possibly particularly colourful charts are regarded as beginner's gadgets.
Nautical charts from the current perspective are far more striking and do not aim to depict the bottom in as much detail as a land surveyor's chart; today they offer a far more reduced chart image.

Also in contrast to the national topography, where the contour lines are averaged, the highest elevation must now be found for the depths; the rest is irrelevant and is removed.
The cartographers are increasingly assisted in this by printouts of the enormously extensive series of plumb lines, in which the same depth figures appear in the same colours.
They also receive information from water and shipping authorities, which now collect data at decimetre intervals using multibeam echo sounders.
Out of 100 such data, only the highest elevation at the bottom makes it into the editorial selection, and only a very small proportion of this makes it onto the map.
As a result, the sheets will be clearer and, compared to previous editions, significantly emptier.
The focus should only be on the danger spots.
White spots now mean that the area is deeper than the surrounding depths.
The land behind the coasts is also increasingly reduced to points actually visible from the sea.
Contour lines and shading, which used to be standard, are also no longer to be found.

In 1986, they were still considered a sensation.
In a commemorative publication on the occasion of 125 years of official German hydrography, it can be read: "The high quality and clarity of this shading design were an achievement standard of the German engravers that was only achieved in the German nautical chart series and made the German nautical charts the best of all." The European maritime survey offices now exchange their data so that survey ships no longer work off foreign coasts.
Due to international chart standards, nautical charts of areas outside their own coasts are also becoming less and less useful.

BSH has been reducing its card programme more and more for years.
However, they did not become cheaper.
From 1903 to 1920, 1.2 million cards were sold, 872,553 of them to the Imperial Navy.
By the end of this period, however, 664 cards had also been issued.
This means that less than 100 cards were issued per year - not exactly bestsellers.
But small print runs meant high prices.
However, the original intention was exactly the opposite: "The prices for the nautical charts are kept extremely low in order to enable their use for all German shipping and deep-sea fishing," was written in the "Contributions to German cartography" in 1921.


 A map of the North Sea coast from 1767, made by Jan Diedrik Trock, focussing on Heligoland and the Wadden Islands
Photo: FVM

Nothing more than a nice memory

Some people may mourn the old, artistic and detailed chart images.
In practice, even the meticulously restored chart table of a hundred-year-old pilot cutter should have an up-to-date sheet.
The labour involved in its creation is hardly noticeable today.
Even in the surveying offices, nostalgia is barely perceptible: apart from historical copies and archived log rolls, there is hardly anything to be found there about the not-so-old copperplate engraving.
A surveyor from the Hamburg harbour authority says frankly: "Sure, we still have a hand plumb bob on board.
But we've used it maybe once or twice in the last year."

The fine art of cartography: from the beginnings to the present day

Sea manuals or sailing instructions are older than nautical charts, although they were not distributed on a weekly basis in 400 BC as they are today.
From the end of the 13th century, the development of the compass led to the first nautical charts, called portolans.
They did not yet have a grid of degrees.
Instead, they are characterised by their distinctive ray pattern, which rather theoretically indicates the courses between the harbours.
In the Mediterranean, for example, they impressed with their surprisingly accurate depictions of the coastline.

From around the 16th century, maps with a grid of degrees were created, but it was only the Mercator projection of 1569 that was really suitable for navigation.
At that time, courses from A to B actually appeared correctly on the map as a straight line (see also "500 years of Mercator", YACHT 17/12).
Around the 19th century, land surveying was increasingly regarded as a government task and at the same time became more and more accurate thanks to improved equipment: the 15 kilometre long Gott - hard railway tunnel was pierced in 1880 with a lateral offset of just 33 centimetres and a height difference of five centimetres using triangulation over the Gotthard Pass.

The coastlines and the sea area in front of them were also reflected more and more accurately in the nautical charts.
Beyond the visual range of land, however, it was only astronomical navigation using the sextant, and later the Decca and Loran, that made ever greater accuracy possible - right up to today's differential GPS.
 
Links :

Thursday, December 26, 2024

Charles Joughin: how whiskey saved the head baker of the Titanic


Joughin would be at the topmost part of the ship by this point.
Loss of the Titanic.
Published in the Graphic Supplement of 27 April 1914

From History Defined by Robert Carlock

Charles Joughin was an acclaimed chef.
He was best known for being the head baker on the RMS Titanic.

Although the extravagance of the voyage is well known, the pastries that Joughin was responsible for creating are not why he is remembered. Instead, Joughin is best known for his remarkable survival in the face of imminent death.

Historians and scientists attribute his survival to one thing: the sheer amount of alcohol he consumed that night.
 
 
Titanic’s Chief Baker Charles Joughin, 1912

The Unsinkable Ship

On April 10, 1912, the maiden voyage of the RMS Titanic would begin.
At the time, the Titanic was one of the largest passenger ships in the world.
It was one of three Olympic-class ships designed by the White Star Line. 

The ship had ten decks, could carry almost 2500 passengers, and was manned by nearly 1000 crew members.
The maiden voyage would only last five days before the Titanic struck an iceberg in the frigid North Atlantic. It sank within two hours.

Although other ships would eventually arrive to pull survivors from the water, only 706 people survived.
Over 1500 would be lost to the icy waters.
This made the sinking of the Titanic the worst maritime disaster to occur during peacetime. 

 
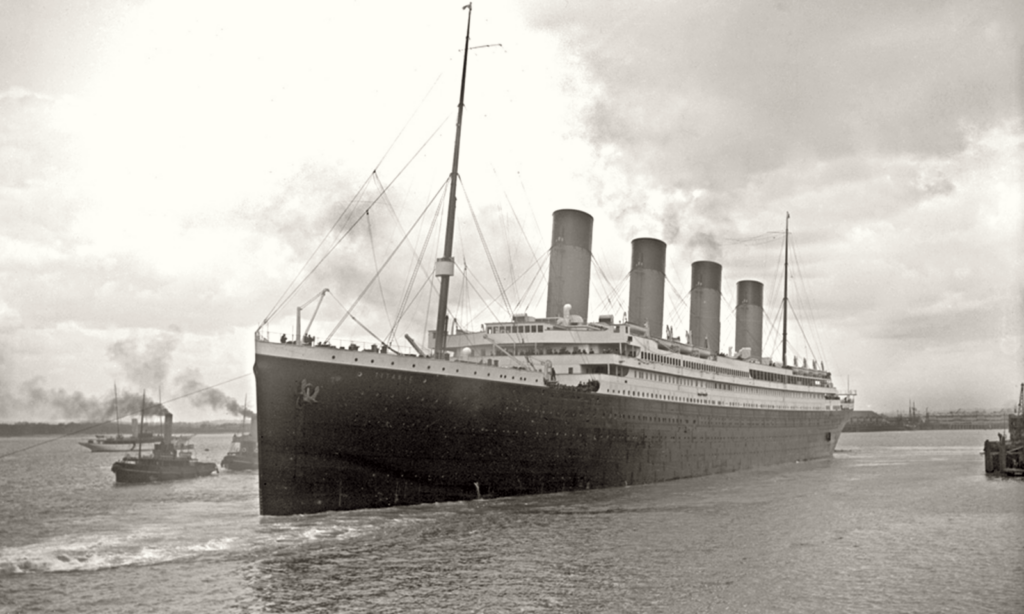
The Titanic leaving Southampton. 10 April 1912

The Titanic Strikes an Iceberg

After the ship began taking on water, panic began setting in.
Some people did not believe they were in trouble since the ship had been marketed as “unsinkable.”

Some stubbornly refused to leave their belongings or quarters that they had paid for.
While others were unaware anything was even wrong.

As it became clear the ship was going down though, many of the crew began insisting that people evacuate the ship and climb into lifeboats.
The Titanic had half as many lifeboats as it was supposed to. Nearly all of them were less than half-filled when they cast off.

Charles Joughin would rally his fellow chefs and bakers to assist in the process of evacuation.
In between rounds of assistance, Joughin would step below deck to have a drink of whiskey, which likely helped keep him warm.

As the ship continued to sink, Joughin maintained this pattern: assist others into lifeboats, go below deck to take another drink, then return to the deck to continue assisting others.
Joughin assisted other crew members in ensuring women and children made it into lifeboats, sometimes even against their will.

They would toss people into any boat that had space before it was cast off from the ship.
Joughin also worked with his staff to throw chairs and other makeshift floatation devices overboard. These were intended to help any other survivors after the ship completely sank.

Joughin Overboard

This continued for hours, until around 2:20 am.
At this time, the sinking ship finally dipped below the waves of the icy northern Atlantic.

Joughin went down with the ship.
He climbed the stern of the boat and stood at the tip.
He rode it down into the water like an elevator.
Joughin and other witnesses even claim that he was able to calmly step into the water as the ship went down, without even getting his hair wet. 

Surrounded by the screams and cries of other survivors, and those frantically trying to stay alive in the frigid waters, Joughin remained unnervingly calm.
He gently trod water for over two hours that night.
He kept afloat until the sun began to rise.

As the early morning light began to fall over the wreckage, Joughin found an overturned lifeboat with other survivors.
While they could not fit him on the boat, they recognized him and held him partially out of the water until they found another lifeboat with space.

Finally, the RMS Carpathia arrived at the scene and began rescuing survivors.
Joughin was pulled from the water.
He only suffered from swollen feet. 

How did Charles Joughin Survive?

Scientists have sought to explain how he survived.
They have determined that his alcohol consumption was likely the key factor in Joughin’s survival, against common sense.

On one hand, alcohol dilutes blood vessels.
Generally, this makes people more susceptible to hypothermia through a process called vasodilation.
This process expedites heat leaving the body through increased blood flow to the skin.

On the other hand, most people who are submerged in cold water die of “cold shock” rather than hypothermia.
The experience of being submerged in water below even 50 degrees Fahrenheit can lead to rapid, shallow breathing, tightened blood vessels, and other panicked responses from the body.

Most people die from drowning or cardiac arrest before hypothermia can set in.
In Joughin’s case, these two canceled each other out.

His diluted blood vessels from the alcohol constricted to normal size with the freezing water.
The psychological effects of the alcohol kept Joughin from feeling the intense cold and having a neurological response of panic.

Since he could not sense the danger, his body did not react.
In this rare case, alcohol saved his life.

Consuming vast amounts of alcohol is not healthy or a suggested practice for nearly any circumstance. It causes increased heart rate, dilated blood vessels, impaired thinking, and slurred speech.

But this perfect storm of symptoms is what saved Joughin. It canceled out the physiological response of cold shock.
This allowed him to gently tread water for over two hours in the frozen Atlantic Ocean.

His survival, along with the image of a drunken baker stepping off the end of the ship like an elevator, has cemented Joughin’s legacy in the history of the Titanic. 

Links :

Wednesday, December 25, 2024

Rolex Sydney Hobart yacht race 2024 preview

 
From SailWeb
 
105 Yachts are set to compete in the 79th Rolex Sydney Hobart Yacht Race starting Boxing Day 26 December on Sydney Harbour.
 
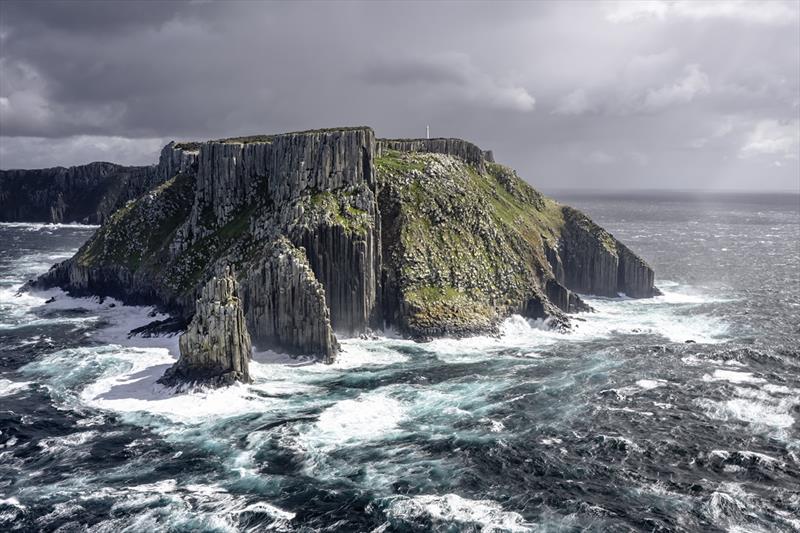
 Relentless waves and squalls at the Organ Pipes
2023 Rolex Sydney Hobart Yacht Rac
photo © Rolex / Kurt Arrigo

This year’s race will feature 23 Double Handed entries, showcasing the growing popularity of this demanding discipline, alongside four 100-foot maxis who will be fighting for the Line Honours victory.
 
Local spectators can look forward to a thrilling display of competitive sailing as the fleet navigates to the Heads and sets a course for Tasmania, tackling one of the world’s most challenging offshore races.
 
Launched in 1945, the Rolex Sydney Hobart Yacht Race has built an towering global reputation to become one of the most famous fixtures on the international sporting calendar.
The 2024 marks the 79th edition of the 628-nautical mile (1,163 kilometre) offshore race from Sydney Harbour to Hobart, the state capital of Tasmania.

 
Starting on its traditional slot on 26 December, an impressive fleet of over 100 yachts are expected to participate.
 
 
Rolex has partnered the event and its organizer, the Cruising Yacht Club of Australia (CYCA), since 2002, the race forming an integral part of the Swiss watchmaker’s long-standing support for yachting.
Stay tuned for more exciting updates for this great race!

Links :

Tuesday, December 24, 2024

Plastic in the ocean and on our plates: What are the risks to human health?

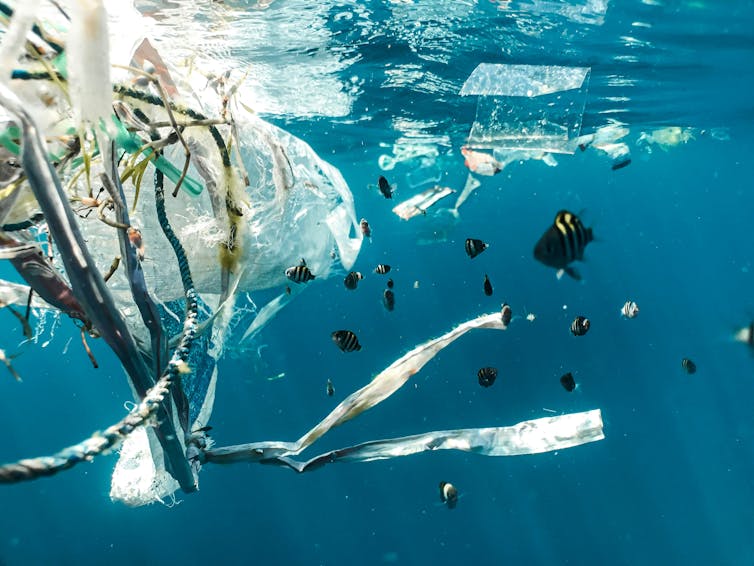
Plastic that enters the marine food chain can end up on our plates.
TravisYewell/Unsplash

From The Conversation by Amélie Châtel

It’s no secret: when we savour a delicious piece of fish or a platter of seafood, we’re not just consuming valuable omega-3s and vitamin D. Alongside these benefits come less appetising elements — countless micro- and nano-plastics.
 
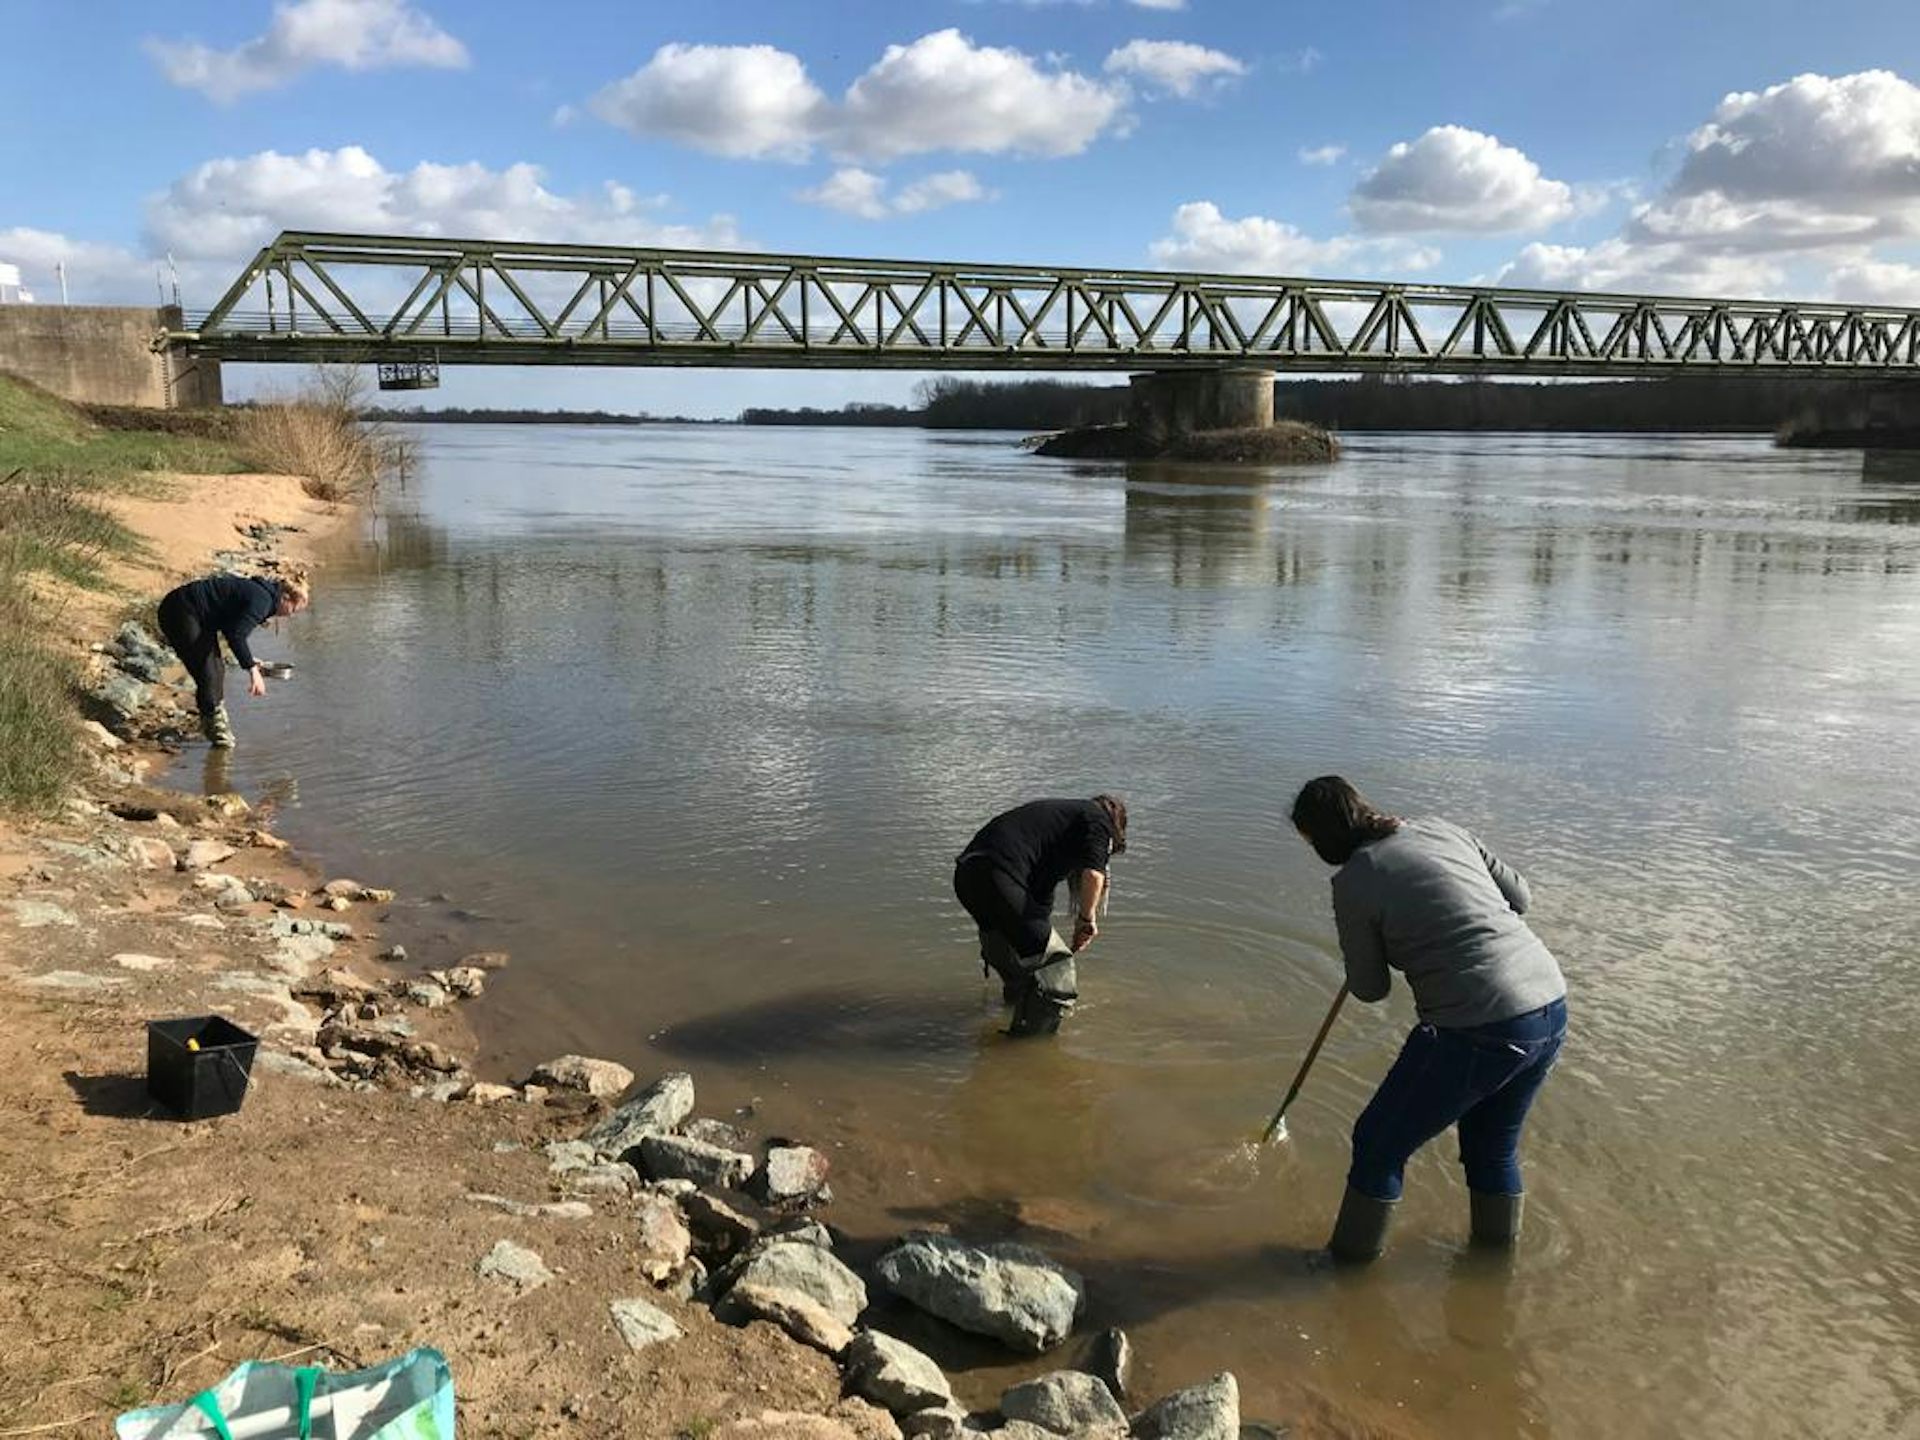
A sampling of the freshwater invertebrates C. fluminea in the Loire river. 
Amélie Châtel

These plastic particles, measuring less than 5 millimetres, enter our oceans through human waste and penetrate the food chain
According to an Ifremer study, around 24,400 billion microplastics are floating on the ocean’s surface. These particles are found in all marine organisms — from microalgae to fish, which occupy higher levels of the food chain. 
This phenomenon not only threatens marine ecosystems but also raises concerns about potential risks to human health.

What exactly do we know about the accumulation of these pollutants in marine life and the dangers they pose to human health?
 
 
Marine organisms bioaccumulate micro- and nano-plastics that humans discharge into the sea.  
 
Micro- and nano-plastics: an invisible threat

Since the 1950s, plastic production has grown exponentially, reaching 58 million tonnes in Europe in 2022 alone. 
This has led to massive amounts of waste.

Over time, wind, waves, sunlight and microorganisms break down larger plastic waste into microplastics (1–5 mm) and nanoplastics (smaller than 100 nanometers), which now contaminate all parts of the environment, including the air, soil and water.

The process by which these plastics accumulate in organisms across different levels of the food chain is known as “bioaccumulation”.
 

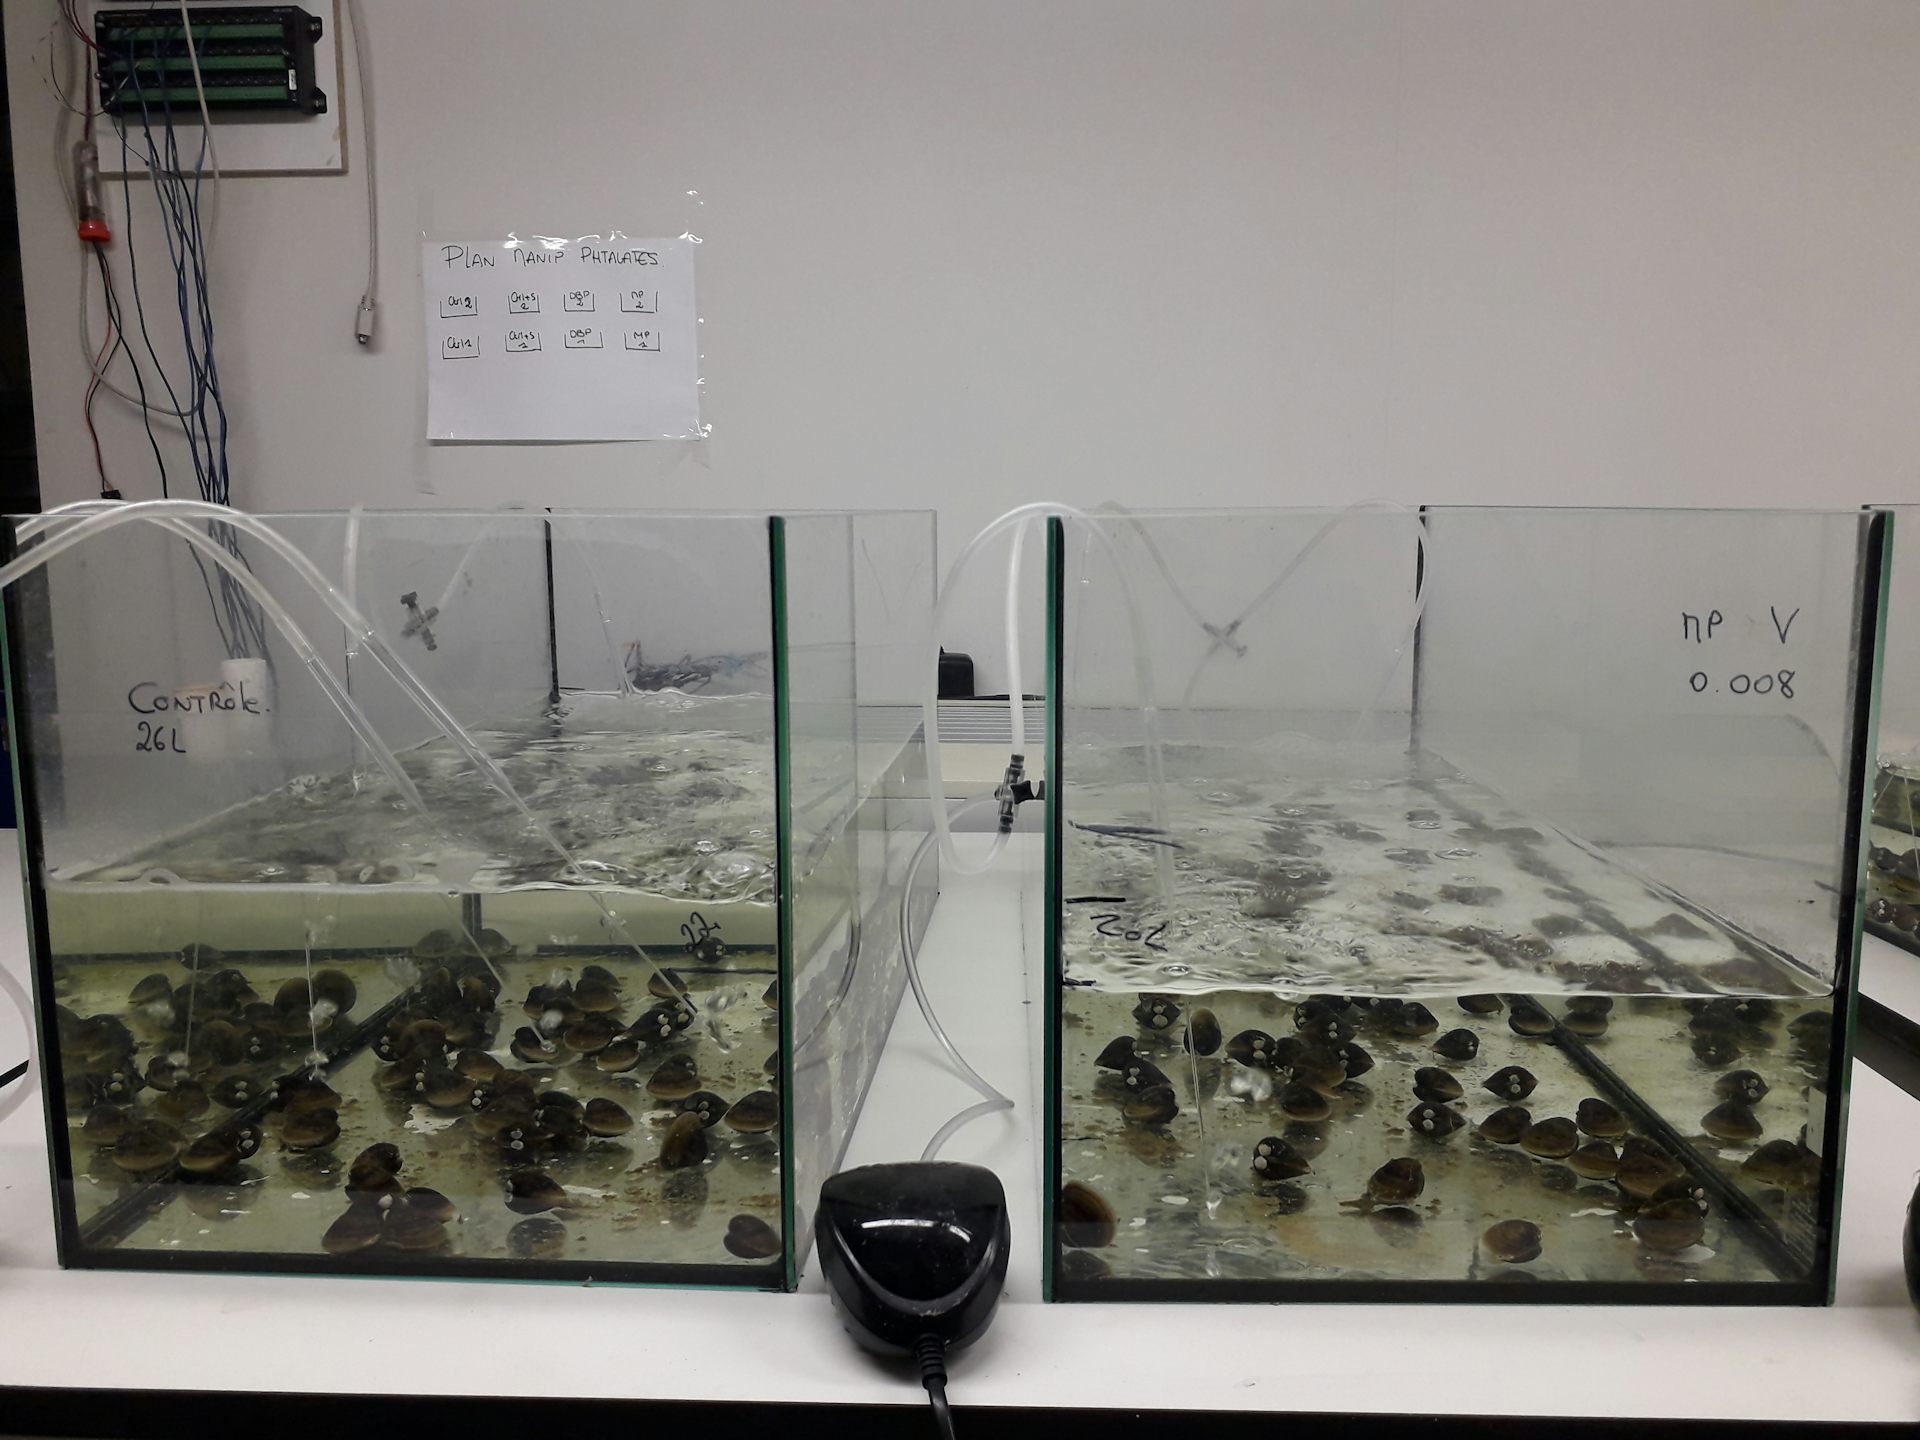
A design experiment from May 2022 » : laboratory exposures of C. fluminea bivalves to microplastics. Alice Vidal

Research from our laboratory reveals that in aquatic environments, micro- and nano-plastics are ingested by a wide range of species — from microalgae at the base of the food chain to top predators like eels.

The impact on marine life

These ingestions have serious consequences. Studies show that microplastics can cause toxic effects in marine animals.

For instance, in mussels, microplastics can block digestive systems, activate immune responses, cause DNA damage and interfere with the expression of genes essential to various cellular functions.

The severity of these effects depends on the plastics’ size, composition, degree of degradation and any harmful chemical additives they may contain.

Plastics often contain high levels of phthalates, which are endocrine disruptors.
These chemicals can interfere with hormonal systems, posing risks not just to marine life but potentially to humans as well.

Risks to human health

Plastics ingested by marine animals inevitably make their way into our food supply.
 

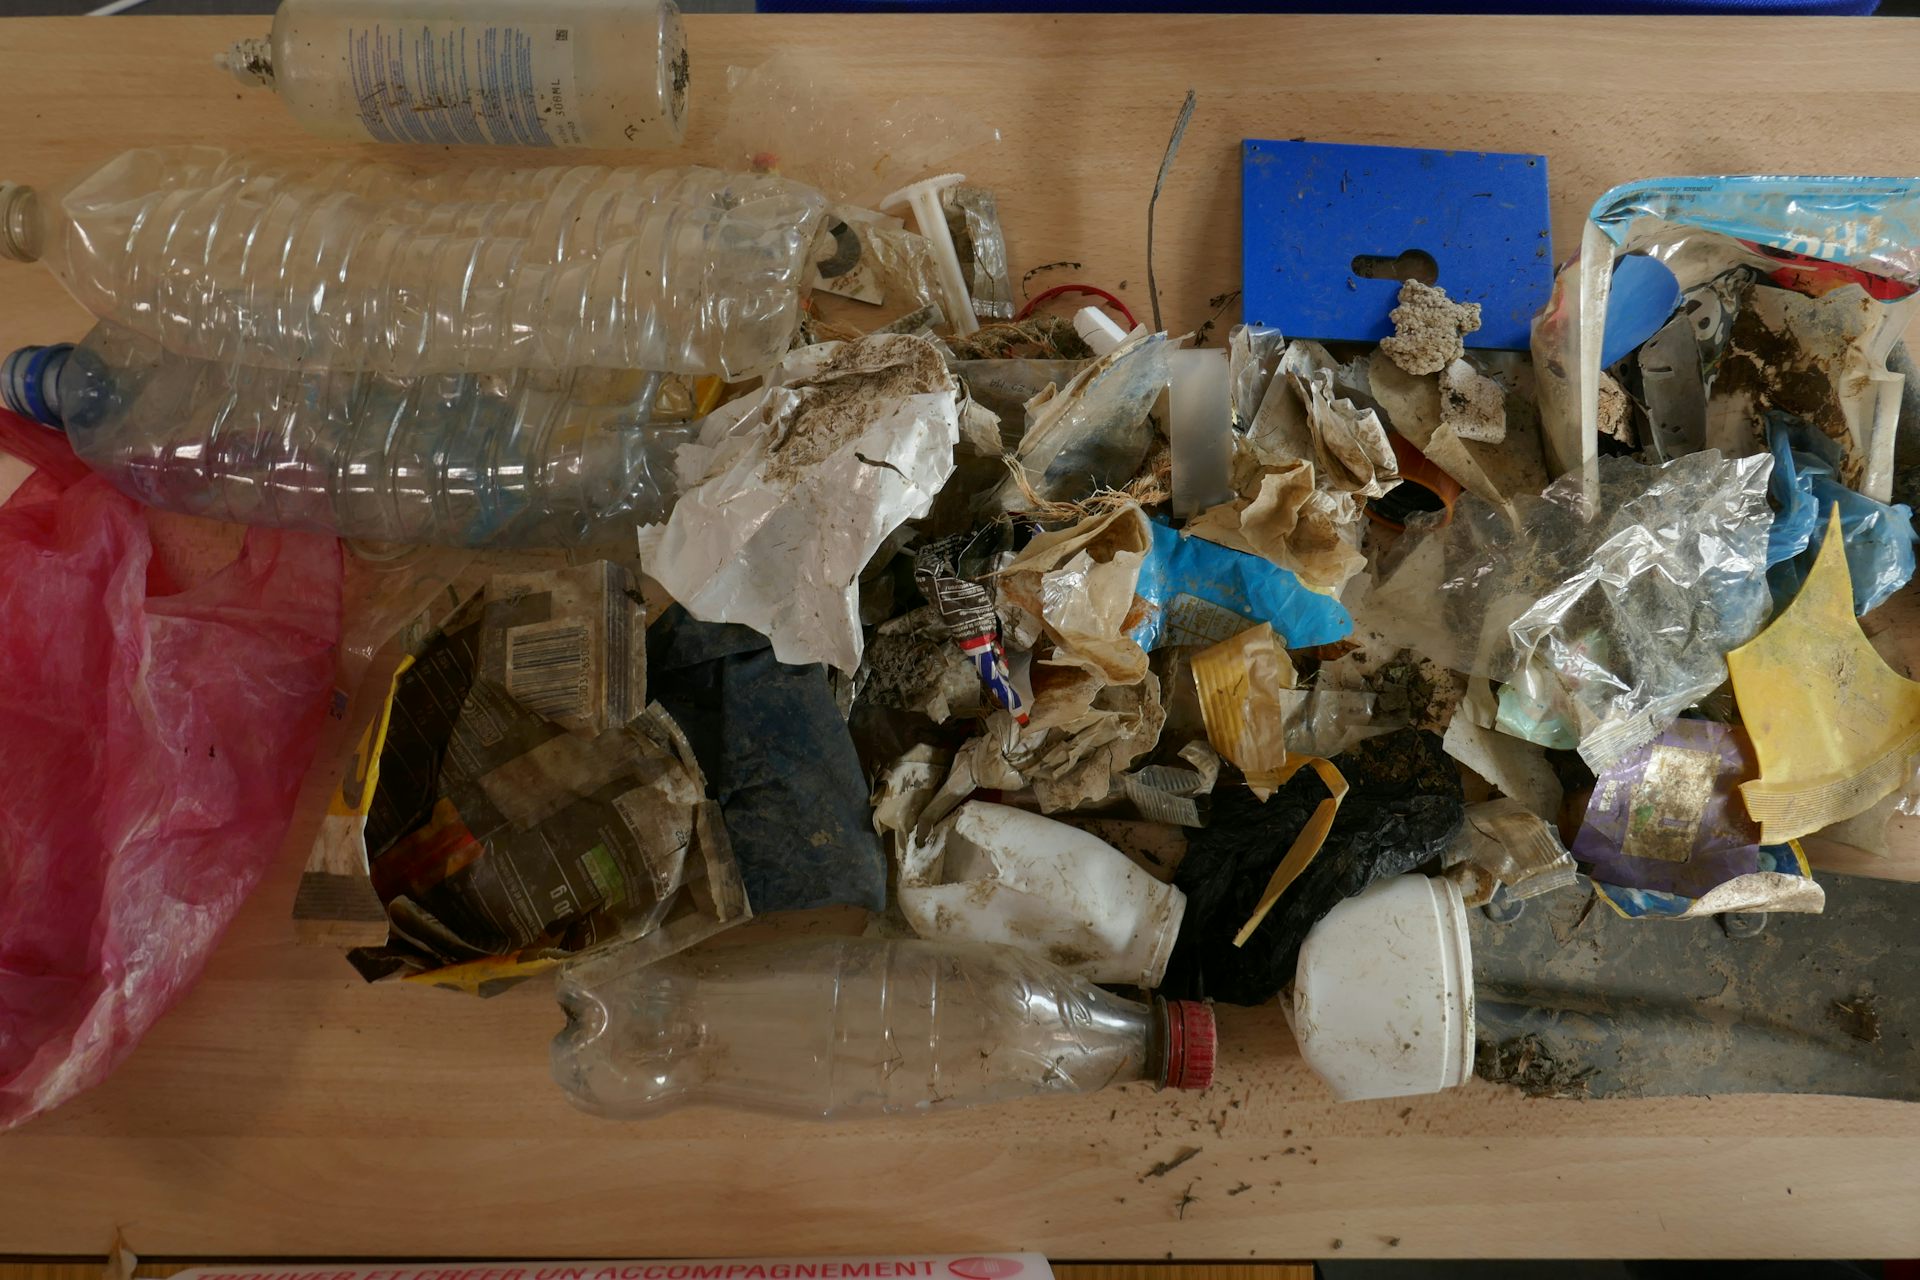
Plastic macro-waste collected at Montjean sur Loire. Amélie Châtel, Fourni par l'auteur

Frequent seafood consumers are estimated to ingest thousands of microplastic particles annually. Although research on the precise health effects on humans is ongoing, some troubling hypotheses have emerged.

Once inside the human body, these particles may cause damage similar to that observed in fish.

Studies on human cells indicate that micro- and nano-plastics can disrupt cellular functions in ways akin to the effects seen in marine organisms.
Scientists are particularly concerned about the toxic impacts of plastic additives.

Additionally, micro- and nano-plastics can act as carriers for pathogens or bacteria, potentially increasing the risk of infectious diseases.

The urgency to tackle plastic bioaccumulation in the food chain cannot be overstated.
By taking swift action to limit plastic usage and improve recycling technologies, we can slow the progression of this environmental and health crisis.
 
Links :

Monday, December 23, 2024

Airlines, shipping companies and sleigh drivers rush to update crucial navigation systems ahead of Christmas rush

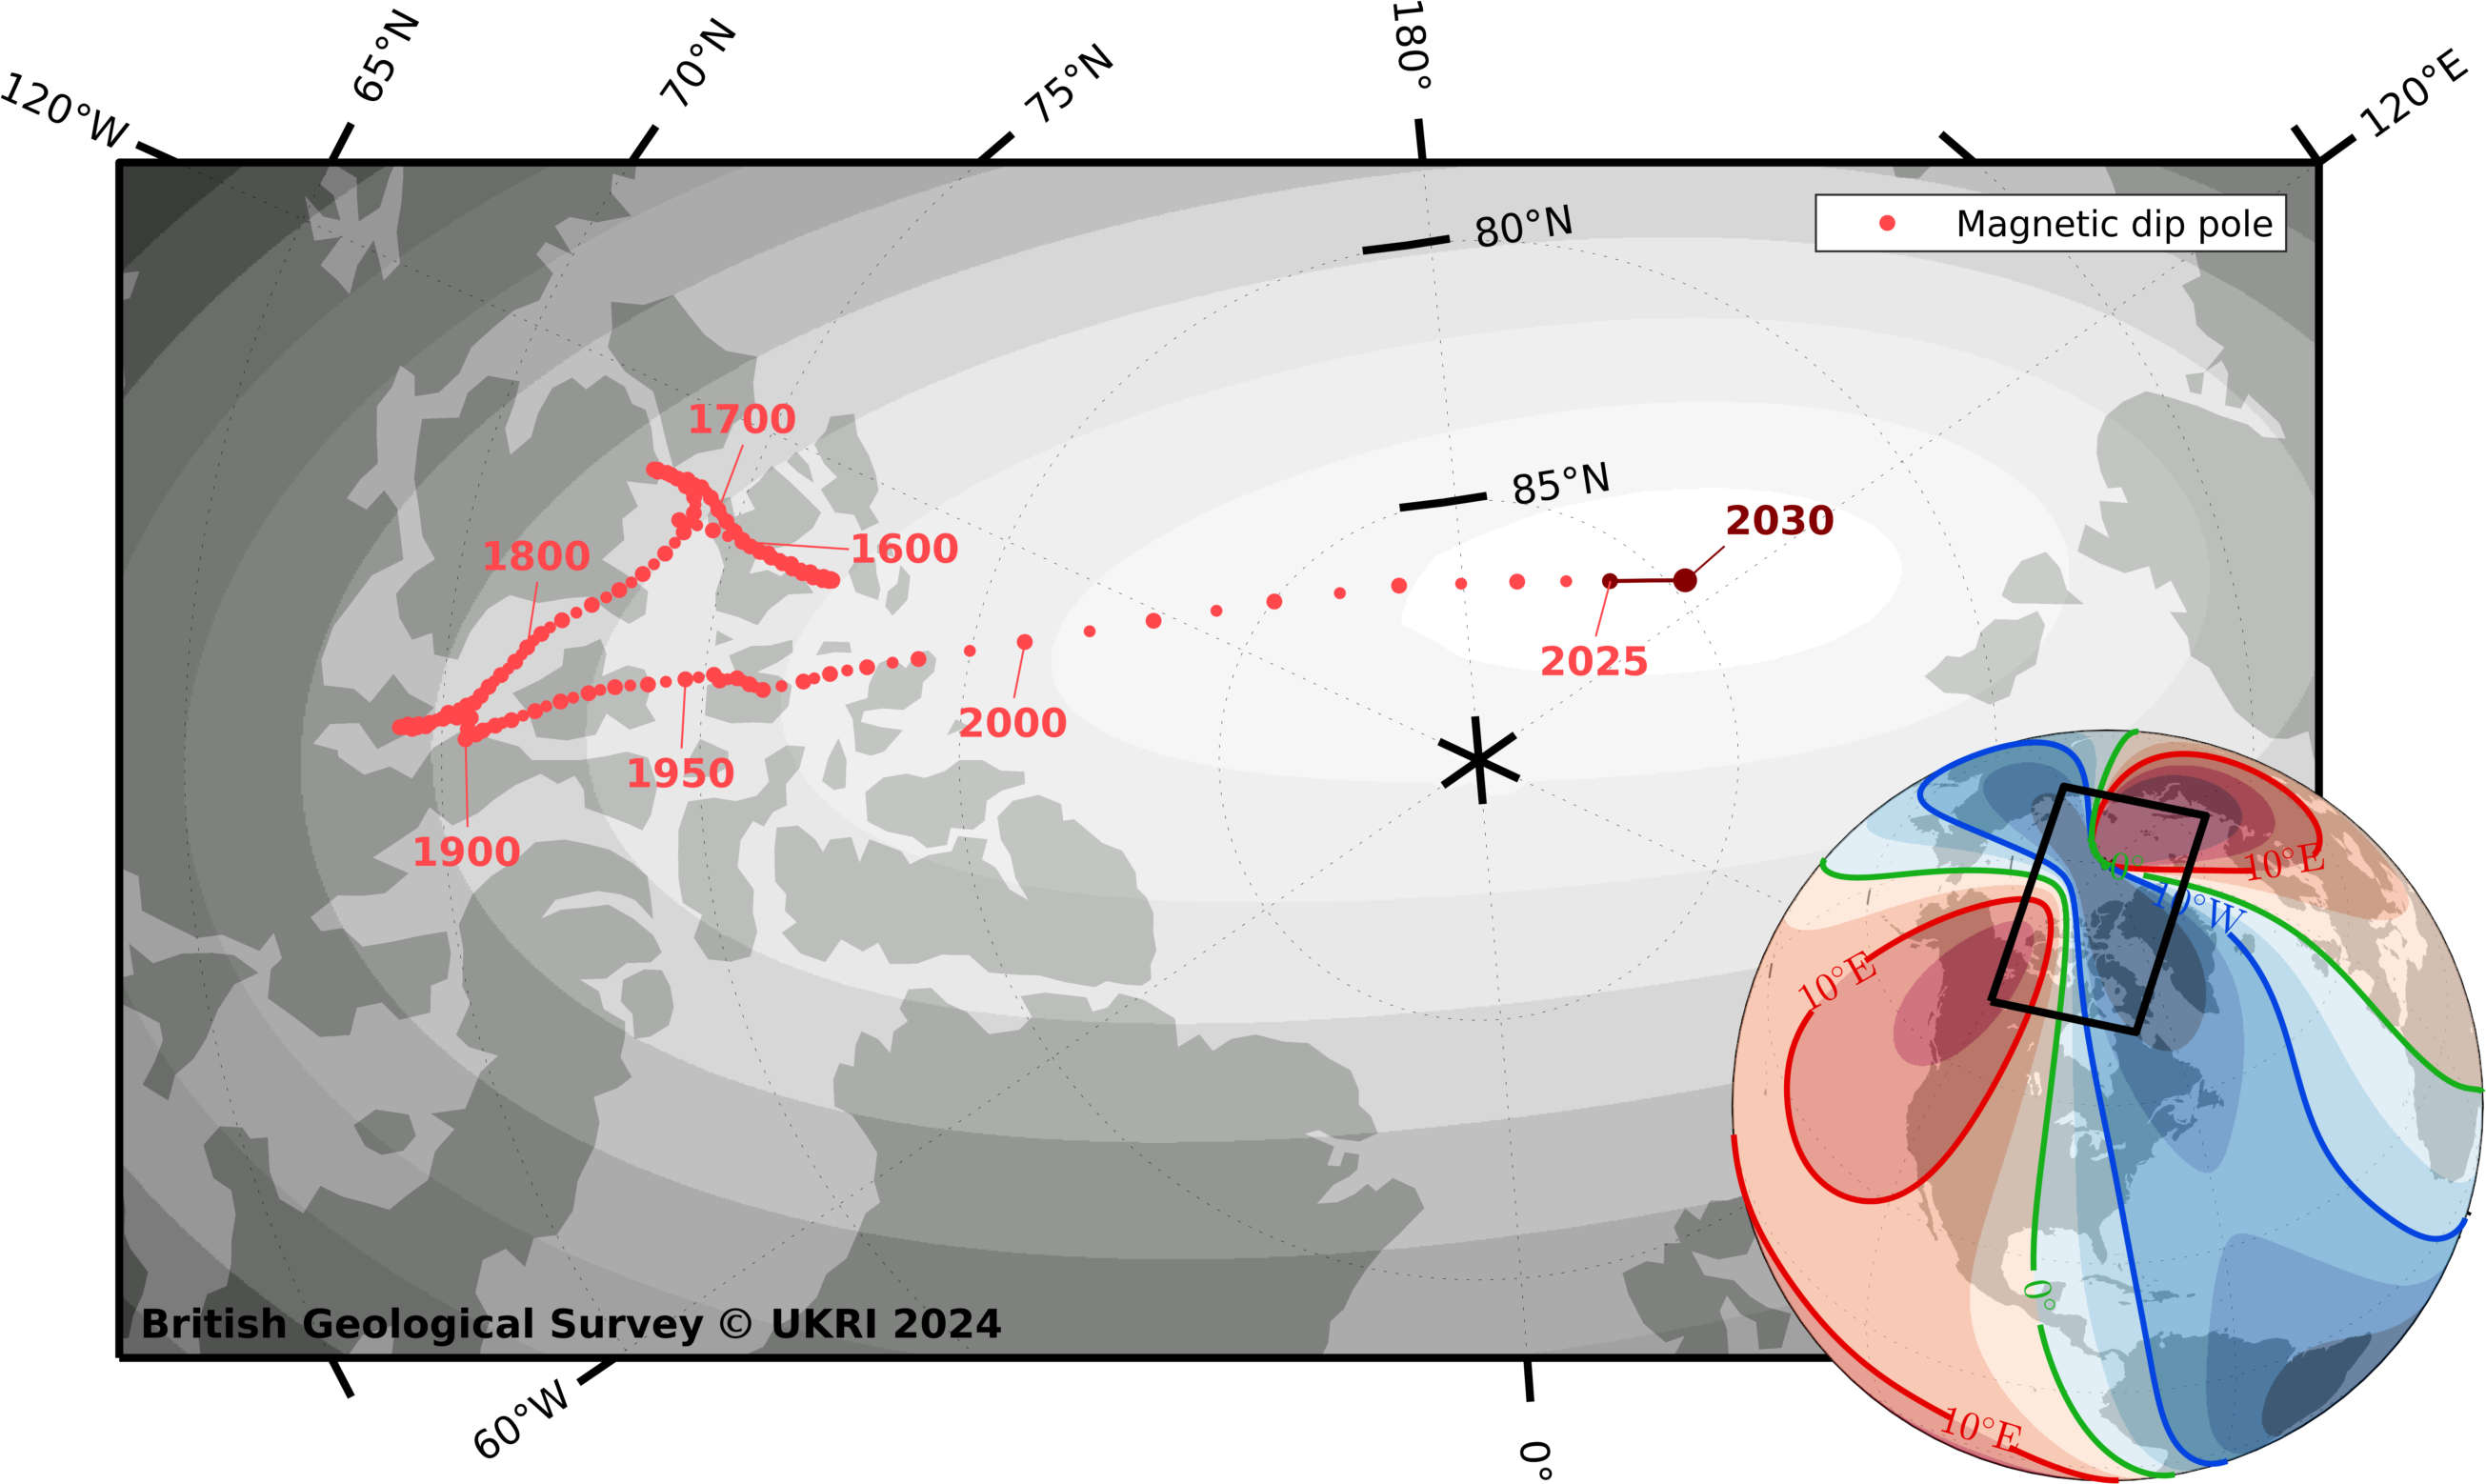
Magnetic declination (the angle between magnetic and geographic north) in 2025 according to WMM2025.
Red is magnetic north to east of geographic north; blue is to west. 
BGS © UKRI and © Wessel, P., and W. H. F. Smith (1996), A global, self-consistent, hierarchical, high-resolution shoreline database, J. Geophys. Res., 101(B4), 8741–8743, doi:10.1029/96JB00104 (v2.3.6)
 
From BGS 
 
Release of major upgrade to a new model tracking magnetic north prompts global reset of satellite tracking systems across trade and passenger transport routes.
 
Hundreds of thousands of mariners, airline operators and North Pole-based gift distribution specialists will be rushing to update their navigation systems after the launch of a new model tracking magnetic north, which is crucial to the accuracy of global positioning systems (GPS) that are relied upon across the world.

In partnership with the UK Defence Geographic Centre and the US National Geospatial-Intelligence Agency (NGA), BGS and the US National Oceanic and Atmospheric Administration (NOAA) have teamed up to update the World Magnetic Model (WMM).


The WMM is the standard model used by the United Kingdom and the United States governments, including the U.S. Federal Aviation Administration and the U.S. Department of Defense, as well as organizations with an international remit such as the North Atlantic Treaty Organization (NATO), the International Hydrographic Organization and the UK Hydrographic Office.

The model comprises a series of magnetic field maps that track changes in the magnetic field, such as the spot at which compass needles point in the northern hemisphere.
To ensure pinpoint accuracy, it is crucial that the shifts in magnetic north, which are caused by flow of the liquid iron in the outer core of the Earth, are taken into account in the electronic equipment that is trusted to guide global trade and enable the safe transit of travellers across the planet.
 
From GPS-enabled mobile phones to nuclear submarines, this improved resolution update will allow navigation with more accuracy than ever before to take place in the run up to Christmas — vital for all those who do not have a red nose to follow.
The WMM is officially released today, ensuring users can have the most up-to-date information so they can continue to navigate accurately for the next five years.
The current behaviour of magnetic north is something that we have never observed before. Magnetic north has been moving slowly around Canada since the 1500s but, in the past 20 years, it accelerated towards Siberia, increasing in speed every year until about five years ago, when it suddenly decelerated from 50 to 35 km per year, which is the biggest deceleration in speed we’ve ever seen.
Dr William Brown, global geomagnetic field modeller at BGS.
While each model predicts how magnetic north will shift over the five-year period to limit any error, the change will have an impact on travellers.
 

Magnetic north pole locations from 1590 to 2030. BGS © UKRI and © Wessel, P., and W. H. F. Smith (1996), A global, self-consistent, hierarchical, high-resolution shoreline database, J. Geophys. Res., 101(B4), 8741–8743, doi:10.1029/96JB00104. (v2.3.6).

Imagine someone was planning to travel by sleigh from a chimney top in South Africa to a snow covered-roof in the UK, a journey of around 8500 km. Using the previous WMM and setting off just one degree off-course, he would end up approximately 150 km away from where he should[1].
With a margin of error of only a few inches between chimney flues, this could cause significant issues.
Values from the updated model can now be calculated, and the WMMHR2025 and the WMM2025 are available for download.
 
Links :

Sunday, December 22, 2024

Chido tropical cyclone over Mayotte

Links :