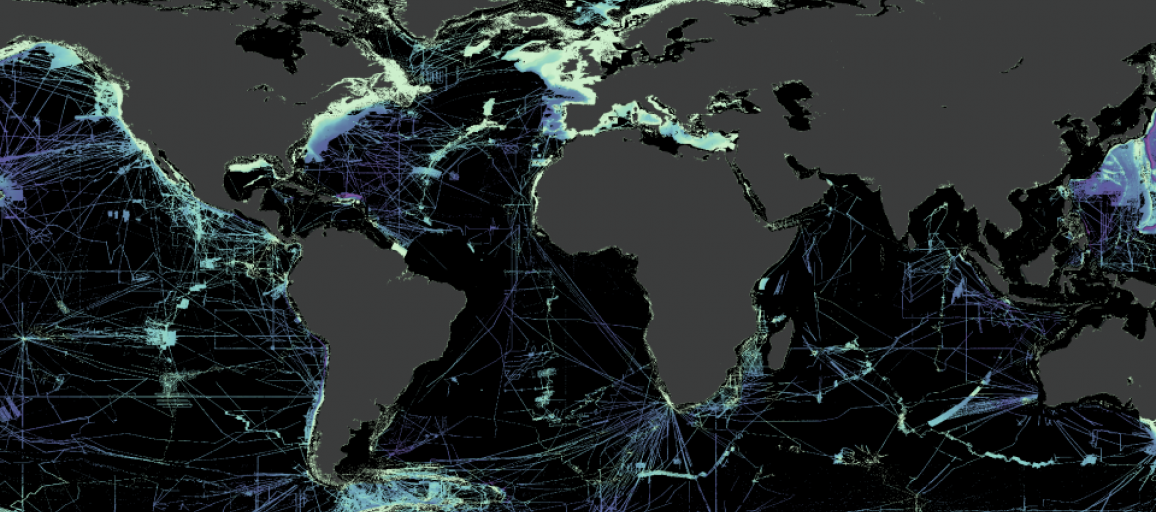
The current bathymetric map of the world’s ocean floor.
The coloured
areas show mapped areas, whereas the black parts show the massive areas
that still have to be mapped.
(Courtesy: The Nippon Foundation-GEBCO
Seabed 2030 Project).
From Hydro by Alex Bastos and Pedro Menandro
The Evolution of Capturing the Seabed
Over the last few centuries, mapping the ocean seabed has formed a major challenge for marine geoscientists. Ocean bathymetric charts and submarine geomorphology have significantly impacted our understanding of our planet, from plate tectonics to deep-sea ecosystems. The history of ocean mapping can be viewed through scientific trends based on words used in the scientific literature. To this end, data mining was carried out on 454 papers dated between the 1930s and 2019 using the keyword ‘seabed mapping’.
The first bathymetric maps were based on ‘lead line’ (plumb) measurements.
In 1855, a first bathymetric profile of the Atlantic Ocean was shown in a textbook published by Matthew Fontaine Maury.
From 1873 to 1876, the HMS Challenger expedition collected more than 500 plumb measurements, revealing the depth of the Mariana Trench and a more comprehensive map of the Atlantic Ocean, with the Dolphin, Connecting and Challenge Ridges, known today as the Mid-Atlantic Ridge.
Bathymetric charts became an important asset worldwide and, in 1903, Prince Albert I of Monaco launched the first General Bathymetric Charts of the Ocean (GEBCO).
The beginning of the 20th century was marked by a change in the seabed mapping approach.
The beginning of the 20th century was marked by a change in the seabed mapping approach.
The development of acoustic technology introduced the use of echosounders, allowing the collection of much more data in much less time.
After World War II, with its extensive use of echosounders, Maurice Ewing, Bruce Heezen and Marie Tharp produced a series of bathymetric maps revealing the physiographic features of the ocean floor, published in a seminal Special Paper of the Geological Society of America (1959).
The ocean floor morphology provided key information to fill in the plate tectonics puzzle, and also supported Wegener’s hypothesis of continental drift. In 1977, the global seabed map produced by Heezen and Tharp and painted by the artist Tanguy de Rémur, The Floor of the Oceans, became a milestone in seafloor mapping and physiography.
The continuous development of acoustic technology brought a novelty to seabed mapping: the revolutionary multibeam bathymetry system.
The continuous development of acoustic technology brought a novelty to seabed mapping: the revolutionary multibeam bathymetry system.
The first non-military multibeam system was used in 1977 during the Jean Charcot Expedition (Seabeam and Hydrochart).
In the past decades, we have witnessed the striking technological development of acoustic and non-acoustic seabed mapping techniques and systems.
Temporal Evolution
The lexical analysis of scientific literature pinpoints the state-of-the-art evolution in seabed mapping over almost a century.
Not only was a growth in scientific production observed, but also a clear trend in the use of scientific, technological and methodological terms.
In general, the literature began with exploratory investigations (‘ocean’, ‘interpretation’, ‘investigation’), shifted to the importance of technology in scientific results (echo, side scan, multibeam), and recently turned toward applications of ocean mapping, as terms such as habitat mapping, seabed classification and backscatter became more common.
The widespread use of the word ‘datum’ over the last decades is also consistent with an increase in data availability and quality.
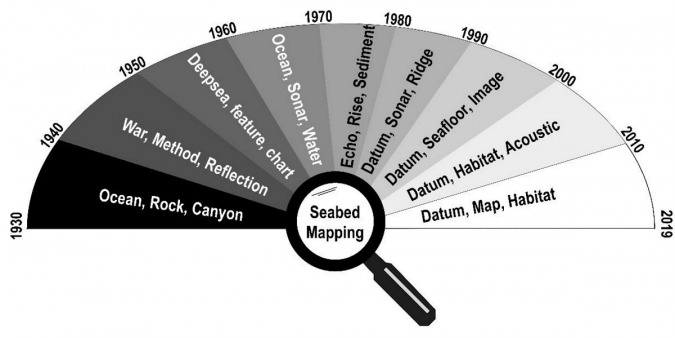 Illustrative scheme summarizing the most frequent words by decade.
(Image source: Menandro & Bastos, 2020)
Over the entire timeframe, it is clear that scientific publications related to seabed mapping have followed investment trends in research, science and technology, but also reflect national and multinational concerns.
In the past two decades, the demand for the definition of exclusive economic zones, support for marine spatial planning programmes, use of the seabed for renewable energy (e.g. offshore wind farms) and the returned interest in deep-sea mining have shaped part of the scientific publications.
Another interesting aspect of the lexical analysis is the increase in publications related to shallow waters (water depth < 200m) in the past two decades.
This may reflect shifting priorities toward coastal and shelf mapping, or that research groups and academics have concentrated their efforts in shallower water mapping.
Of course, deep-sea mapping is much more expensive and requires a more robust infrastructure, so access to suitable technologies for deep-water studies is more limited.
However, looking ahead, and considering new technologies, the use of autonomous underwater vehicles is still novel, so we can expect an increase in scientific publications related to high-resolution deep-sea mapping.
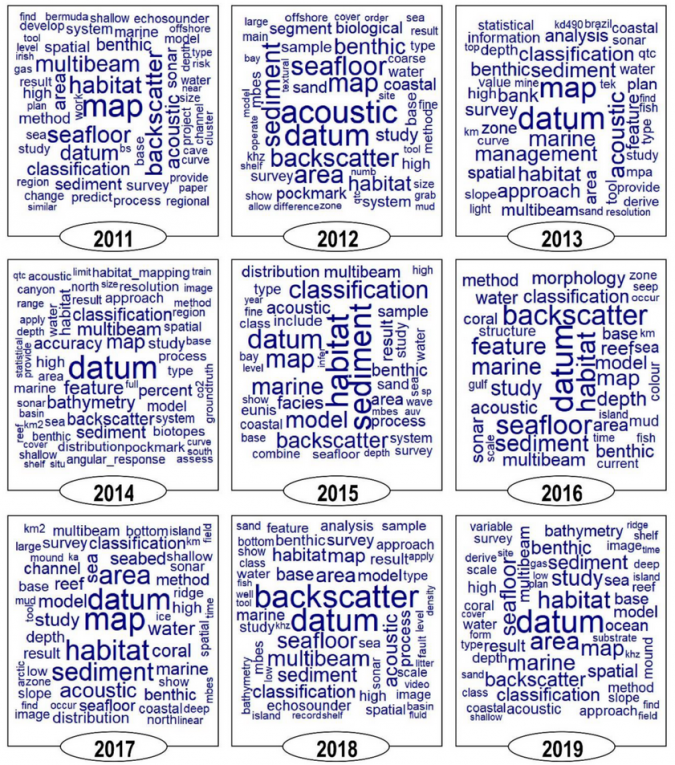
Word cloud composition for each year in the last decade. (Image source: Menandro & Bastos, 2020)
Concentrating the analysis on the last decade, the term ‘backscatter’ has become almost as popular as seabed mapping.
Terms like ‘classification’ have also become widely used in publications.
This represents the effort being made to develop seabed classification schemes, tools and approaches. Seabed mapping as applied to habitat mapping has significantly increased in scientific publications during the last decades.
One of the main demands in habitat mapping is seabed classification, using supervised and non-supervised, and automatic and semi-automatic approaches.
The demand for classification and accuracy can be seen in the increase in terms such as ‘accuracy’ (2016, 2017, 2018 and 2019), ‘repeatable’ (2017, 2018 and 2019), ‘multispectral’ (2017, 2018 and 2019) and ‘machine learning’ (2018 and 2019).
Once again, technological developments and new data analysis tools are driving scientific publication.
Importance and Future Directions of Seabed Mapping
The last century has seen an impressive development in ocean mapping technology and efforts. Technology, innovation and data analysis are changing faster than ever, and ocean mapping is also following this trend.
The United Nations’ declaration of the Decade of Ocean Science for Sustainable Development (2021–2030) states that a map of the ocean (digital atlas) is a research and technology development priority area (R&D Priority Area 1).
From 2017 to 2021, Seabed 2030, an international effort led by the Nippon Foundation with the support of IOC, IHO, GEBCO and several other partners, was able to increase the percentage of mapped ocean floor from 7% to almost 20%. The target is to have the entire seafloor mapped by 2030.
All these challenges and efforts highlight the importance of ocean/seabed mapping.
A bathymetric chart, a seabed morphology/physiographic map or a classified seabed is needed for all kinds of applications, including hydrography, marine geohazards, mineral resource exploration, renewable energy, marine spatial planning, exclusive economic zone definition, technological research and development, fishery resources management, environmental impact studies and climate change models.
All of the social targets of the UN Decade of Ocean Sciences also require seabed mapping.
Following the trends observed in the lexical analysis, the evolution of seabed mapping will probably consist of increasingly integrated investigations using new technology for data acquisition (AUVs, multibeam, multispectral multibeams, Lidar, underwater drones), sophisticated classification tools (unsupervised approaches, machine and deep learning, convolution neural network), and possibly new features and geographical analysis.
As the seabed is mapped, we will learn more about our ocean morphology.
The Five Deeps Expedition and the Northern Depths and Ice Age Geology of the Great Barrier Reef Expeditions are good examples of new ocean floor data revealing unknown features or mapping the real depth for the first time.
Exploration during the next decade will therefore have a profound impact on our knowledge of the oceans.
Exploration during the next decade will therefore have a profound impact on our knowledge of the oceans.
This will enable us to discover new marine landscapes, predict seabed habitats (mainly deep-sea habitats) for better resource management, improve circulation and climate models, and hopefully make the data available for everyone.
The effort to achieve the sustainable development of the oceans demands ocean mapping, and the scientific publications on seabed mapping will register the new findings and developments achieved during this decade.
By 2030, our knowledge of the ocean seafloor will have developed significantly, as happened with the seminal work The Floor of the Oceans by Bruce Heezen and Marie Tharp.
This will impact not only the marine geosciences but the entire marine sciences.
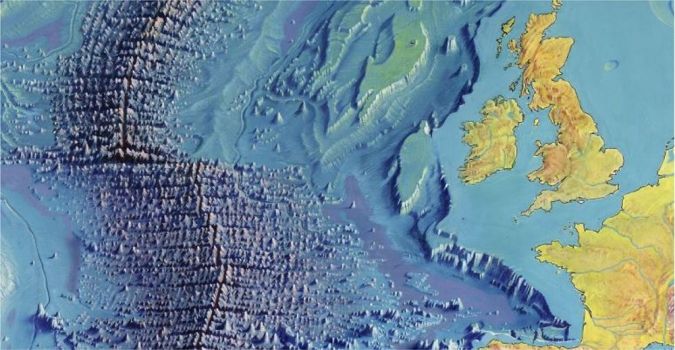 Detail of the North Atlantic Ocean floor map by Bruce Heezen and Marie Tharp, painted by the Austrian painter and cartographer Heinrich C. Berann (Courtesy: US Library of Congress, Geography and Map Division).
see Antique Maps
Links :
- Menandro, P.S.; Bastos, A.C. Seabed Mapping: A Brief History from Meaningful Words. Geosciences 2020, 10, 273. https://doi.org/10.3390/geosciences10070273
- GeoGarage blog :Marie Tharp’s adventures in mapping the seafloor, in her own words
No comments:
Post a Comment