From Medium by Alex Diamond, Eduardo Franco, and John Shriver
Geospatial analysis of shipping data allows Descartes Labs to forecast freight prices months ahead of the competition.
Next time you’re perusing the internet, take a quick detour to the website MarineTraffic where you’ll encounter the ability to track more than 200,000 ships navigating the open seas each day.
From cargo vessels to tankers and tugs; fishing boats, and “pleasure crafts,” the virtual ocean looks like a swarming beehive of activity.
The sheer number of vessels displayed on the website makes it clear that seaborne transport is critical to supplying the needs of modern life.
The International Maritime Organization sums it up well with this quote:
Maritime transport is essential to the world’s economy as over 90% of the world’s trade is carried by sea and it is, by far, the most cost-effective way to move en masse goods and raw materials around the world.Why is maritime transport so cost-effective?
It comes down to economies of scale that arise from the massive volume of goods that each ocean-going vessel can transport.
The largest modern container ships can carry more than 10,000 FEUs (forty-foot equivalent units), or over 25 million cubic feet in total!
With each container currently priced close to $1,300 USD per FEU, this allows merchants to send containerized goods across the ocean for only around 50 cents per cubic foot.
Shipping the same load by air freight could cost more than $4,000 USD and would add significant restrictions for heavier cargos.
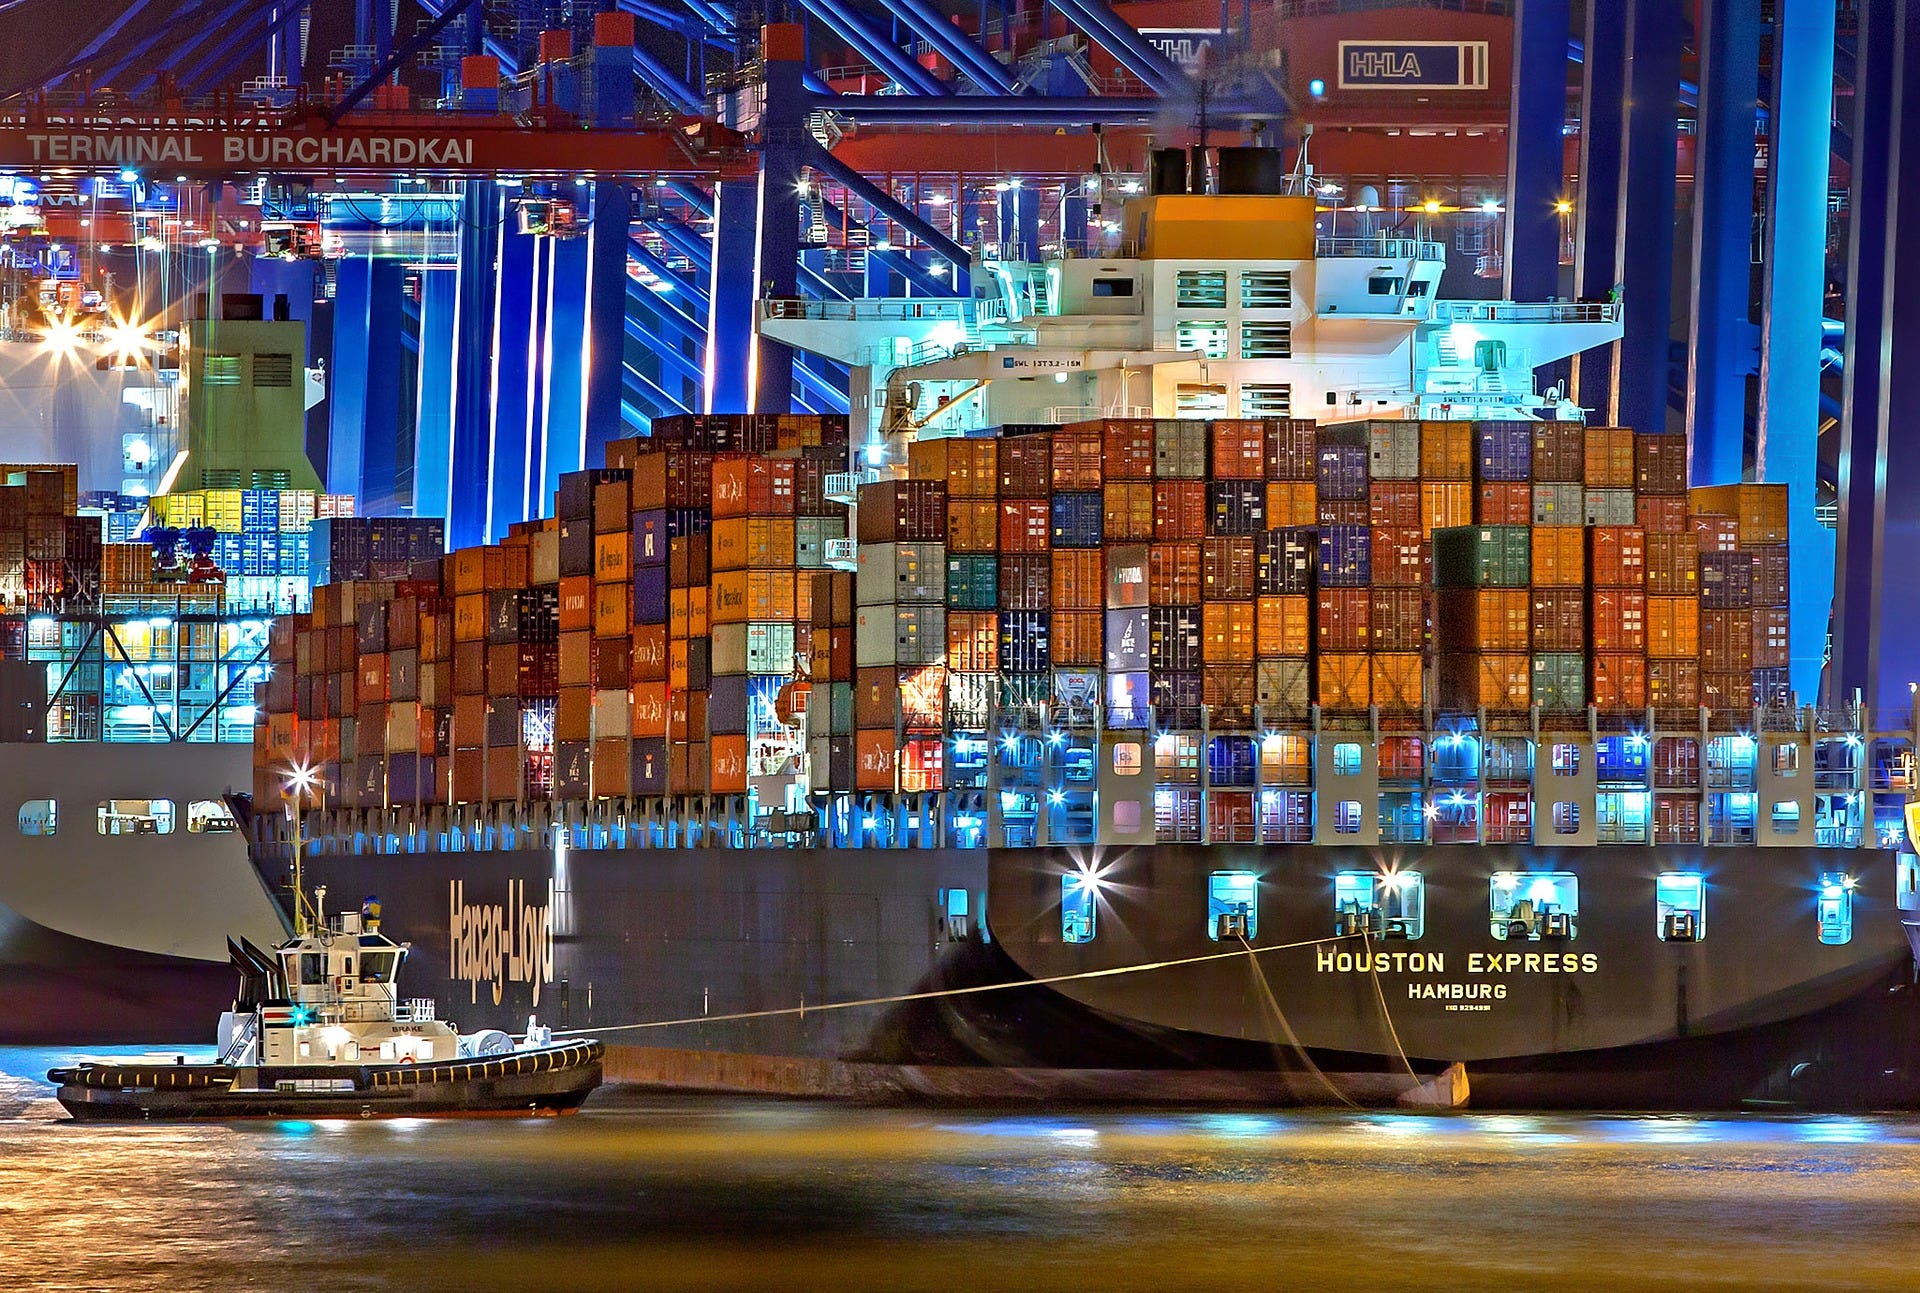
Shipping has been a critical component of a functioning society since ancient times (Comfreak/Pixabay).
Vessel Specialization
Much of the economies of scale described above are enabled by the specialized handling of the bulk material being transported, with containerization — in use since the 1960s — being the most well-known example.
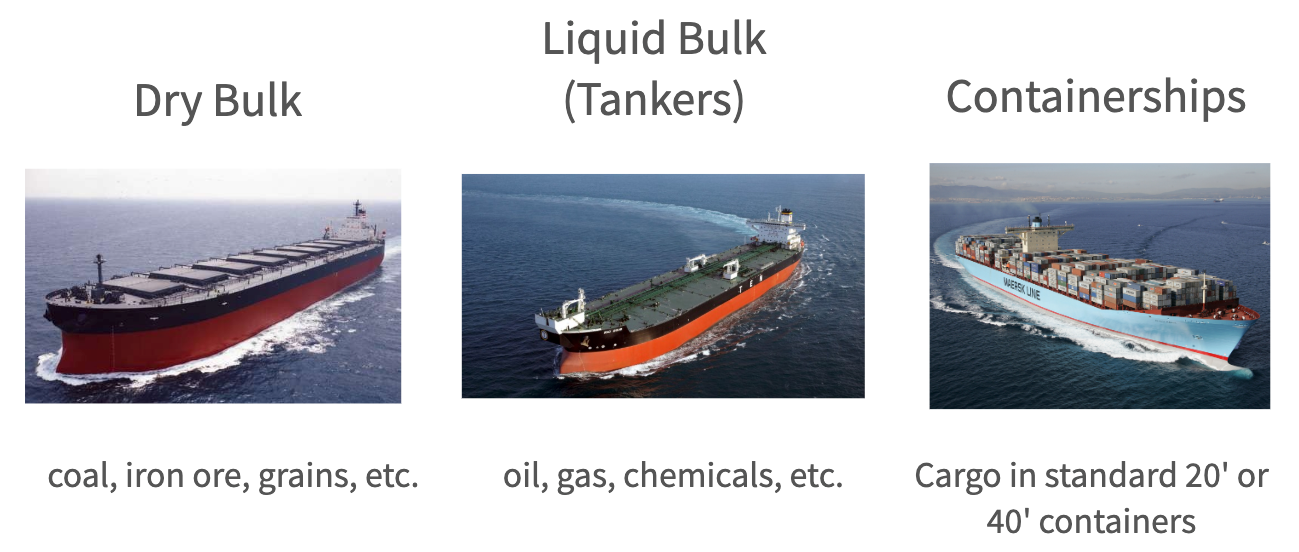
Bulk cargo is often classified into three primary categories, each with its own unique ship design, outfitted to carry a specific type of commodity.
The three primary categories; dry bulk, liquid bulk, and containerships, are displayed below.
Bulk cargo ships are specialized according to the materials they transport
(source: MundoMaritimo.cl and phys.org).
In addition to ships designed to carry different types of materials, there are also significant variations in ship size to meet transport needs.
Ship size depends on the supply and demand of the material being transported; plus the distance covered, the route selected, and any obstacles encountered while moving from point A to point B.
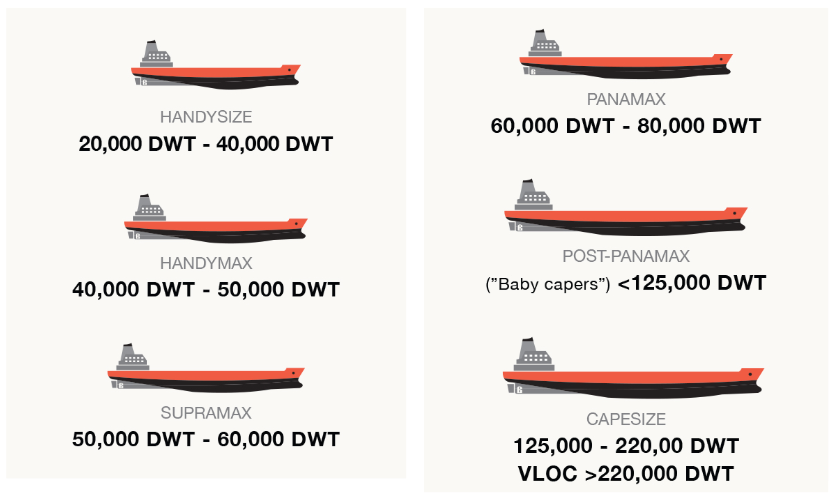
The image below shows the relative size and deadweight tonnage (DWT) of each dry bulk shipping category.
The size and deadweight tonnage (DWT) of each shipping category.
Very Large Ore Carriers (VLOC) are designed to carry large quantities of ore to fast-growing economies in Asia and the Middle East.
The size and deadweight tonnage (DWT) of each shipping category. Very Large Ore Carriers (VLOC) are designed to carry large quantities of ore to fast-growing economies in Asia and the Middle East.
Ships that are smaller than Handysize are specialized for river transport, as their reduced dimensions are necessary to pass under bridges and to navigate shallow waterways.
Handysize and Handymax ships are usually general-purpose in nature and represent the majority of bulk carriers in use today, as increased government regulations and stricter risk management resulting from the 2008 financial crisis have limited the financing of larger vessels.
Moving up in size from Handymax, Panamax ships, which traverse the Panama Canal, are functionally restricted by the berth and depth of the Panama Canal’s lock chambers, while Capesize ships cannot pass through the Panama Canal at all and must travel around Cape Horn to navigate between the Pacific and Atlantic oceans.
Only recently have some Capesize ships been able to pass through the expanded Suez Canal, which was completed in 2015.
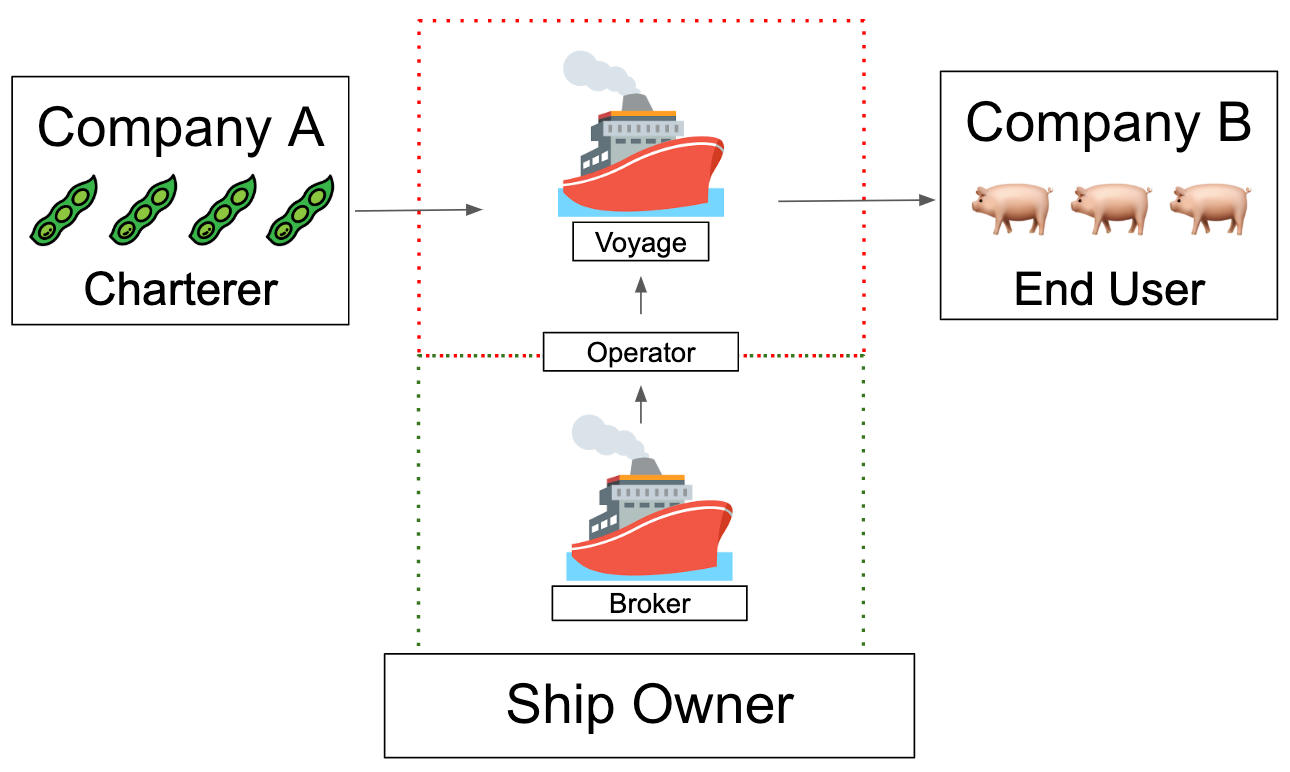
In addition to ship type and size, the ocean transport industry typically involves four primary market participants:
- Owner — Usually an asset-heavy company that owns a commercial ship and equips it for delivering cargo either on a per-voyage or a time-bound basis.
- Charterer — End-users who typically own cargos that need to be moved from one location to another. These are often producers or traders.
- Operator — Normally asset-light entities that are responsible for the end-to-end operation of a voyage. They typically buy time from ship owners and sell point-to-point services to charterers.
- Broker — Intermediaries managing the buying or selling of shipping services between owners and charterers.
Typical bulk shipping scenario involving all four market participants.
One might imagine a typical scenario in which Company A, a charterer, wants to deliver grain from South America to the United States to be used in animal feed for Company B, a food processor.
Typically, Company A would contact a broker to arrange a quote for a voyage between two ports on a specific date.
The broker would work with an operator and potentially a shipowner to secure the proper vessel and crew to match the cargo being transported.
Assuming everything checks out, the charterer would sign off on the quote and proceed with the shipment.
But what if the cost to ship the material is higher now than it was three weeks ago when the charterer first started the conversation?
Would the charterer attempt to save money by storing the material for a period of time and waiting for shipping costs to decline?
What variables would they need to understand to move forward with that decision?
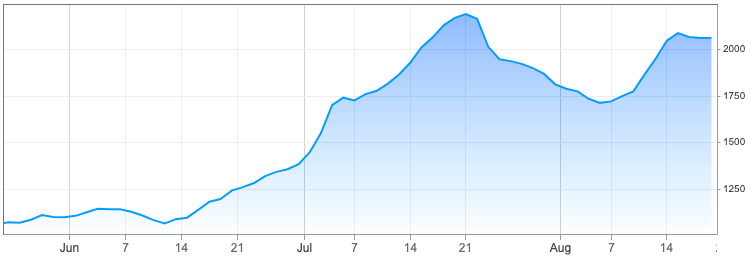
Volatility in the Baltic Dry Index
Descartes Labs is building a digital twin of our planet.
Our
ocean transport price modeling process helps shipping companies
optimize charter rate decisions by forecasting route-specific Baltic Dry
Index price changes 1–2 months ahead.
(source: CNBC).
Systematic Fundamental Modeling
At Descartes Labs, we use our systematic fundamental modeling process and proprietary customer data to help charterers make better forecasting decisions.
Our process helps operators plan for increased price volatility and optimize Baltic Index charter rates 1–2 months ahead.
Using a “quantamental” modeling approach, we blend fundamental supply and demand factors with macroeconomic and geospatial data to predict route-specific charter rates in all market environments.
We can do this for shipping prices, or almost any financial or operating metric.
A powerful example of some of the geospatial data we work with are transponder signals from the Automatic Identification System (AIS) devices required on larger vessels.
These radio signals are generated through an onboard navigation safety device that transmits and monitors the location and characteristics of large vessels in international waters in real-time.
In its raw form, AIS data is fairly noisy, requiring cleaning and cross-referencing with outside datasets (e.g.
vessel databases) before it can be used effectively.
Over the past few years, we’ve successfully ingested multiple sources of AIS data into the Descartes Labs platform and now use it frequently for customer projects.
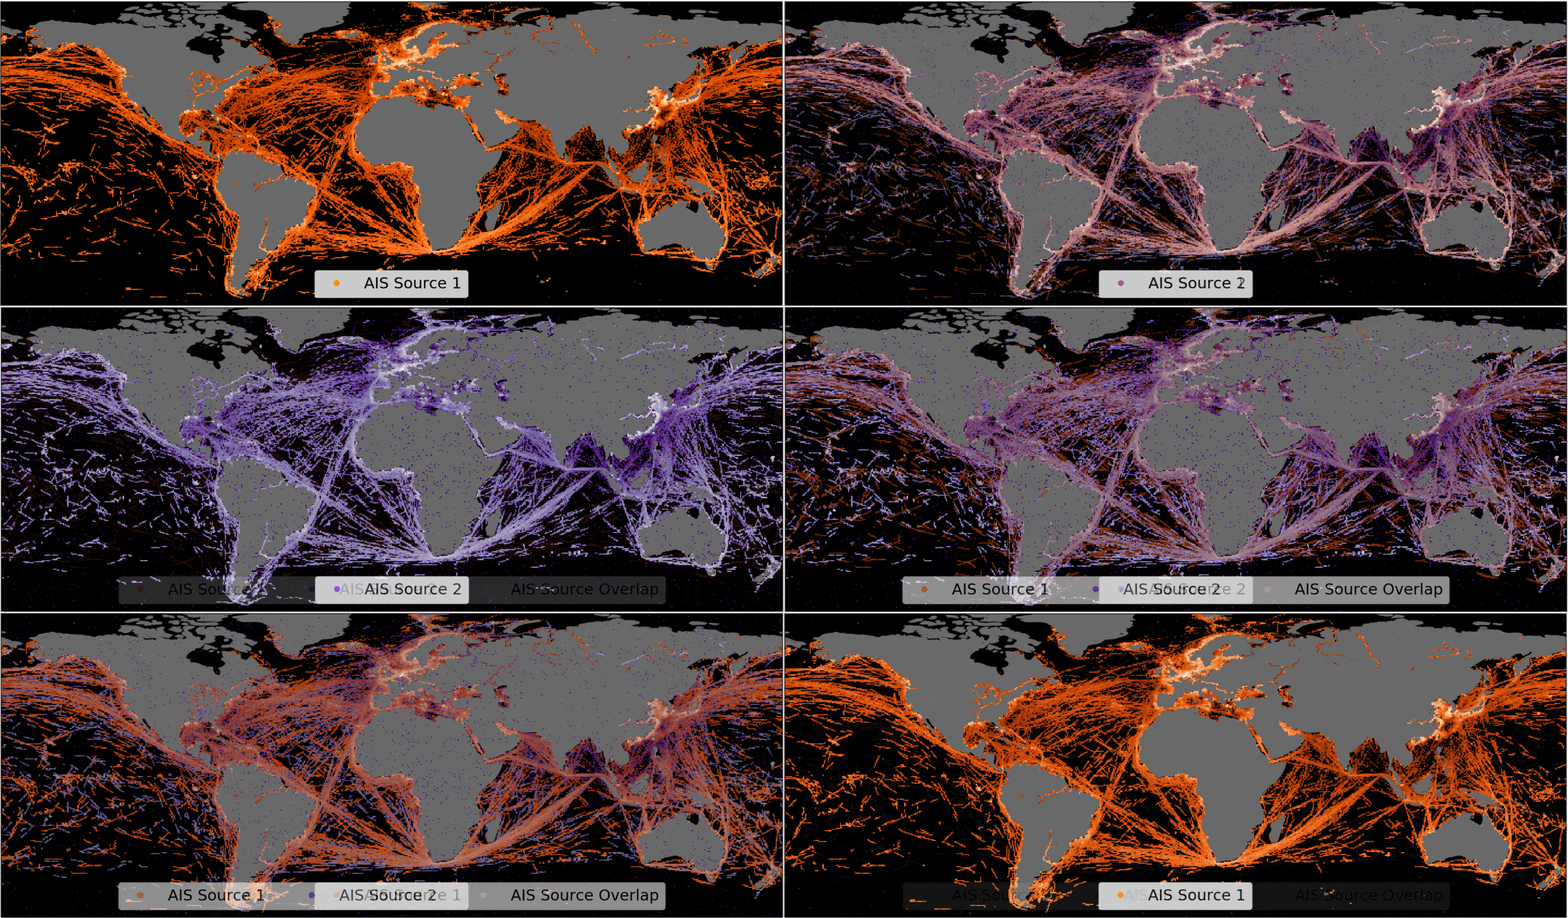
One of the big advantages of using AIS data from Descartes Labs is that we fuse information from different AIS sources to get the best coverage available.
The graphic below shows the incomplete coverage and variability between two AIS datasets and the more complete coverage that arises when they are combined.
Fused AIS data from multiple sources provides significantly improved coverage and completeness.
But even when AIS datasets are fused and coverage is complete, there still may be a lot of work to clean and normalize everything prior to analysis.
With billions of AIS pings in total, bad data is a frequent issue.
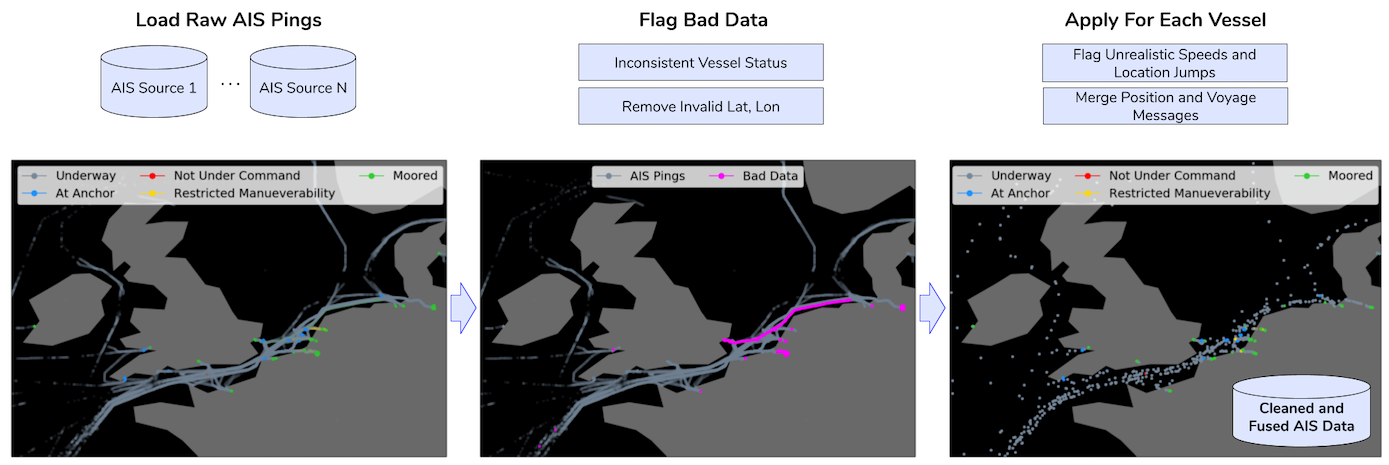
We define it as any vessels that have moved more than ten miles further than they should have based on a vessel’s reported speed and timestamps, anything that was moving more than ten times its reported speed, or anything that is moving more than one knot while moored.
Our process for cleaning bad data is laid out below.
A simplified process for cleaning bad AIS data
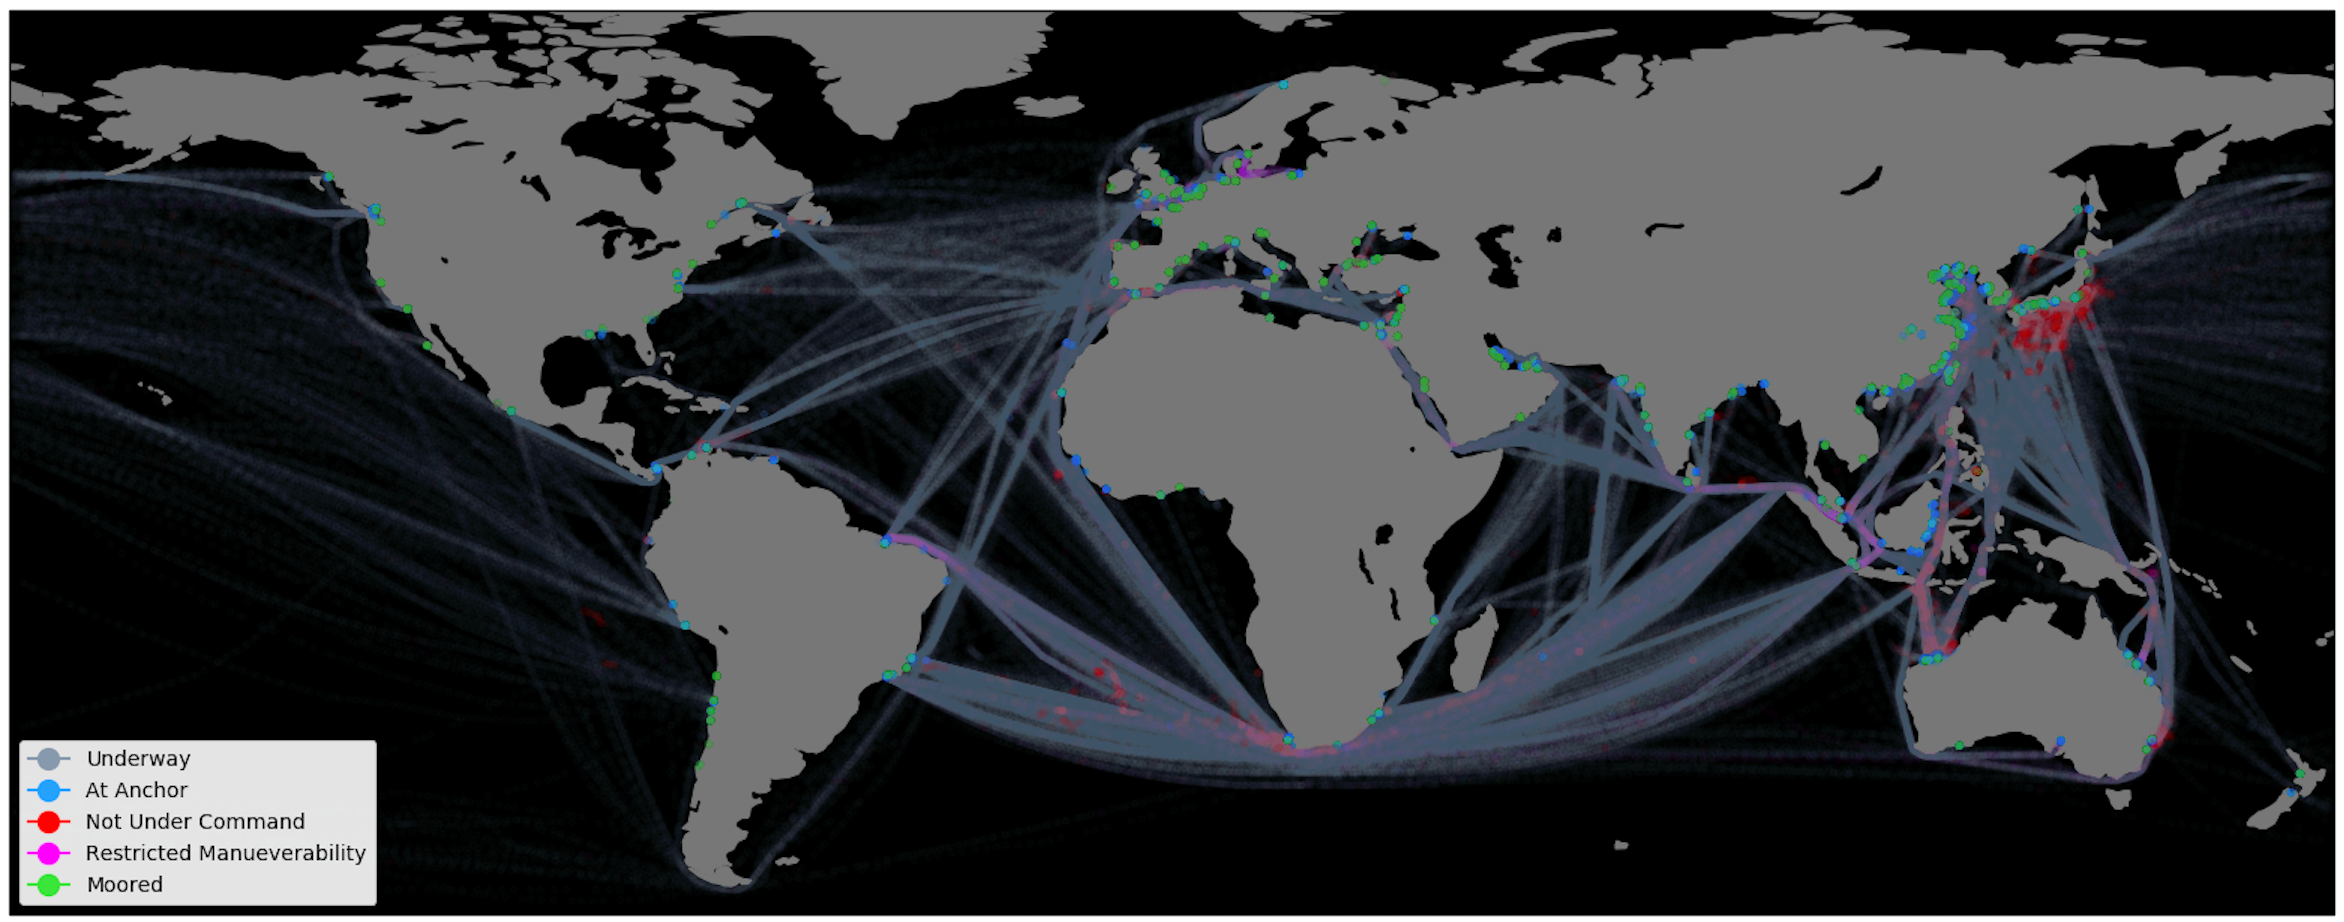
Once all the data fusion and cleaning is done, we’re left with an analytics-ready dataset like the one displayed below.
Our ability to process geospatial data at a huge scale enables customers to get answers quickly and make informed decisions.
Color marks the status of each vessel in this cleaned AIS dataset (Descartes Labs).
Beyond AIS data, the processing pipeline for freight rate forecasting involves additional fundamental and macro data ingest and cleaning using the Descartes Labs Platform.
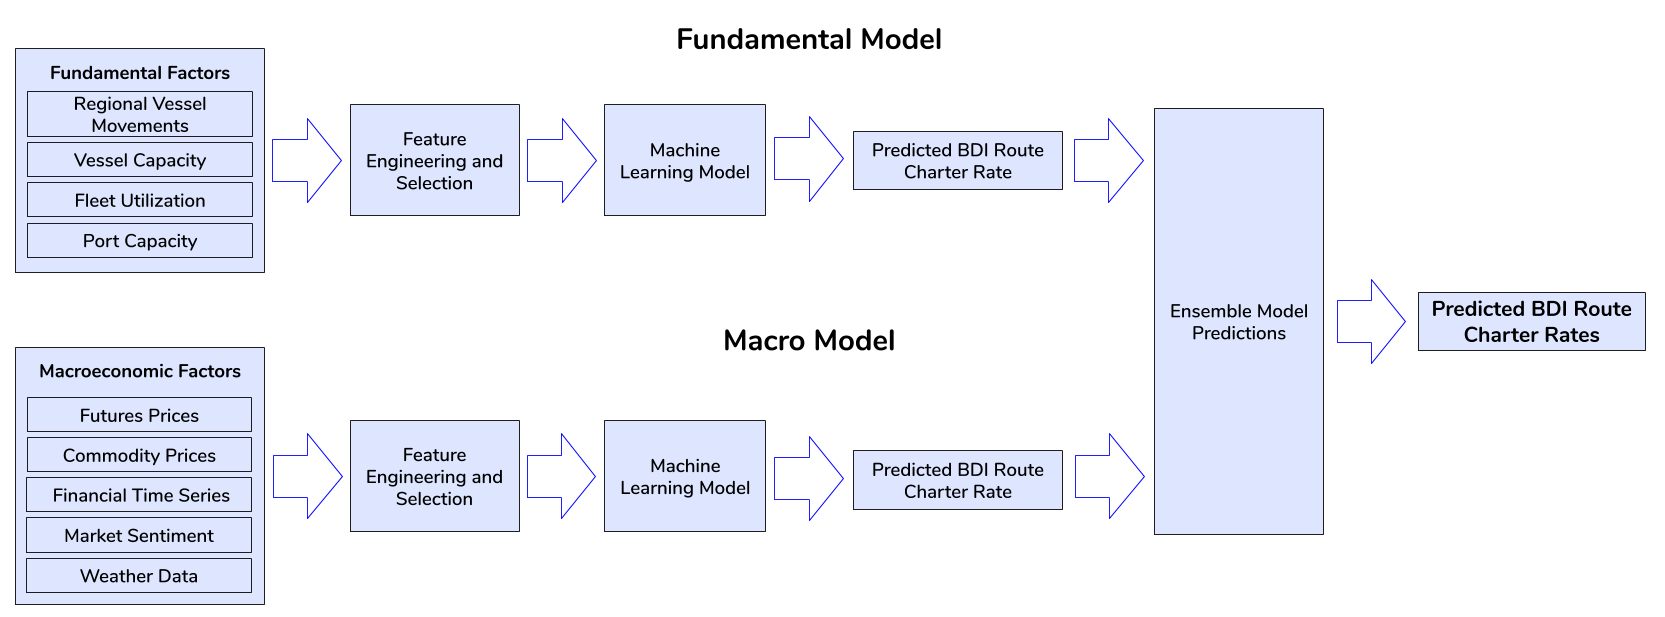
Once the datasets are calibrated and analysis-ready, we perform feature engineering to identify the unique variables that contribute most to model performance, such as the ratio of ballast-to-laden vessels in a specific location, or vessel counts at congested ports.
Our final models are ensembles of fundamental and macro models, that reflect the blended influence across markets changing over time.
In general, the most common factors may include:
- Vessel supply and trade flow analysis including AIS-derived vessel patterns, potential destinations, advertised tonnage, and vessels in ballast
- Commodity supply and demand such as imports & exports of coal, iron ore, grains, or other commodities by country and region
- Historical prices, seasonality, bunker prices, and forward freight agreements
- Intangibles including weather, new vessel supply, macroeconomics, port logistics and more
We do this by employing robust, blind-set practices and eliminating data leaks with simulated noise series.
The end result is route-specific charter rate forecasts produced by the methodology below.
This process is a tangible example of how quantitative science can be translated into actionable forecasts that all market participants can use.
Research Area: Iron Ore Market Dislocation
As part of ongoing research and backtesting, we often evaluate how our forecasts would have performed in various macroeconomic scenarios.
One area of research is how vessel supply, routes, and prices changed across the iron ore ocean transport market before and after the Brumadinho dam failure and the resulting shutdown of multiple iron ore mines in Brazil.
The repercussions from the Brumadinho disaster are still being felt today, approximately nine months later, as Brazilian mining regulators recently announced that Vale misrepresented what it had done to shut down its riskiest dams.
The legal fallout continues even as impacts to the iron ore ocean transport market have largely returned to normal.
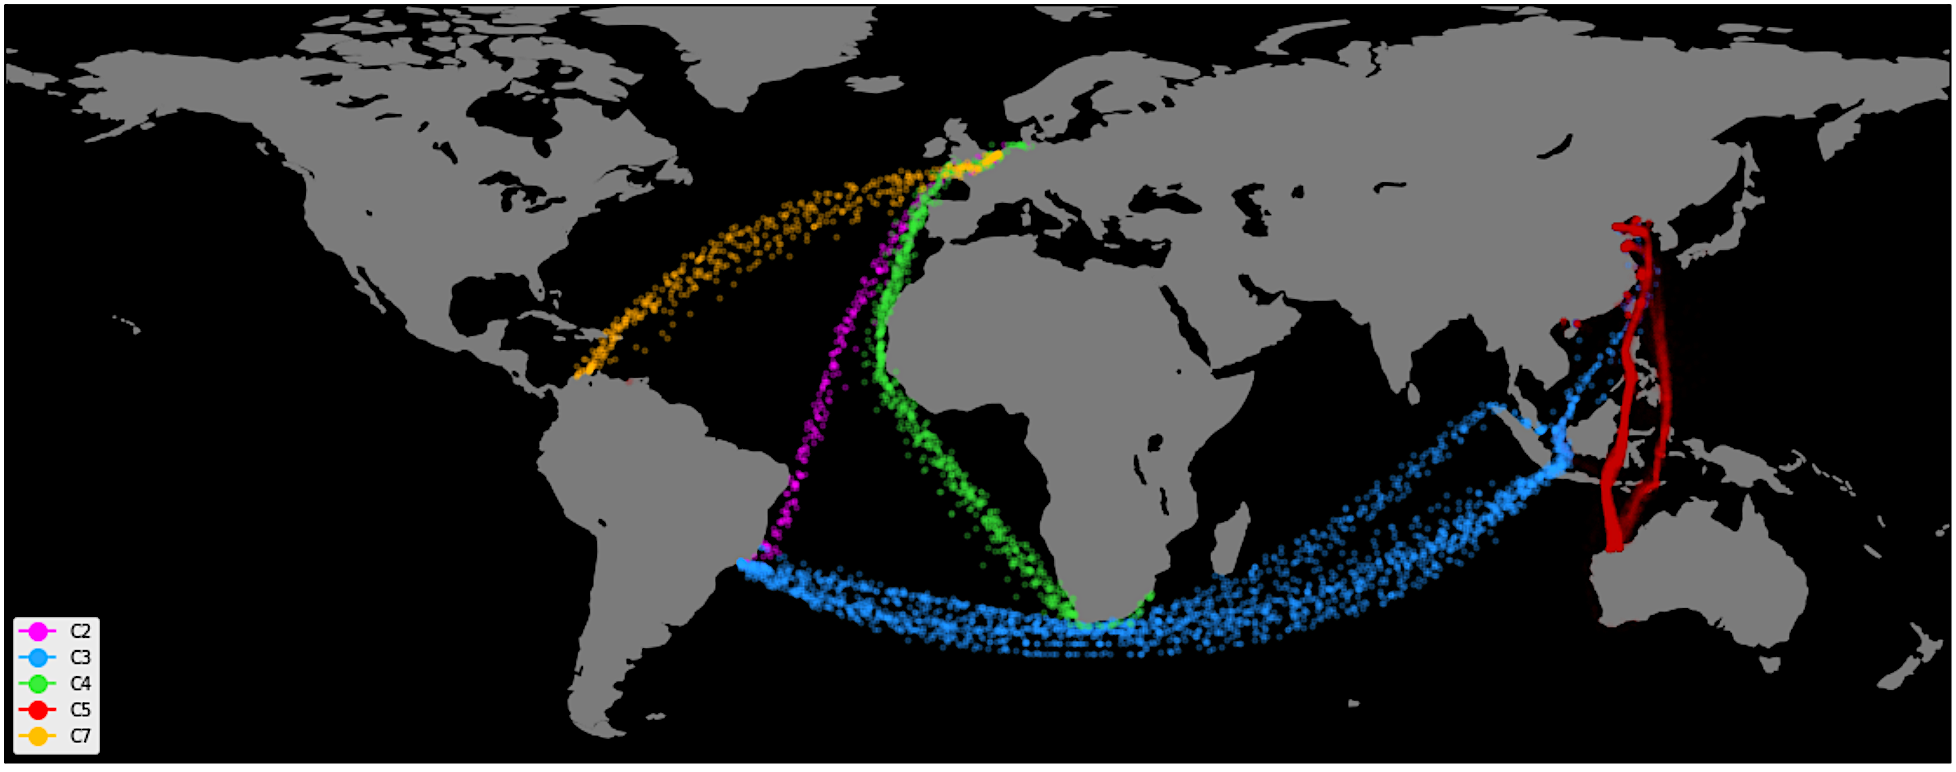
Looking into AIS data relating to iron ore, the graphic below depicts the major commodity-specific Capesize Dry Bulk routes.
These routes make up about half of the total Capesize contribution to the Baltic Dry Index.
Specifically, routes C2, C3, C5 are iron ore and C4 and C7 are coal.
One of the more interesting things about these routes is that they often operate on a one-way basis, shipping iron ore or coal on the “front-haul” portion of the route, and often return cargo-free and loaded down with ballast on the “back-haul” portion of the route.
Visualization of AIS data depicting the major commodity-specific Capesize Dry Bulk routes.
Most of our focus has been on the C3 route that ships iron ore from Brazil’s major export terminal in Tubarao to China’s major import terminal in Qingdao.
Looking at iron ore market data and 3rd party studies for the C3 route suggest that rates fell significantly after the Brumadinho disaster.
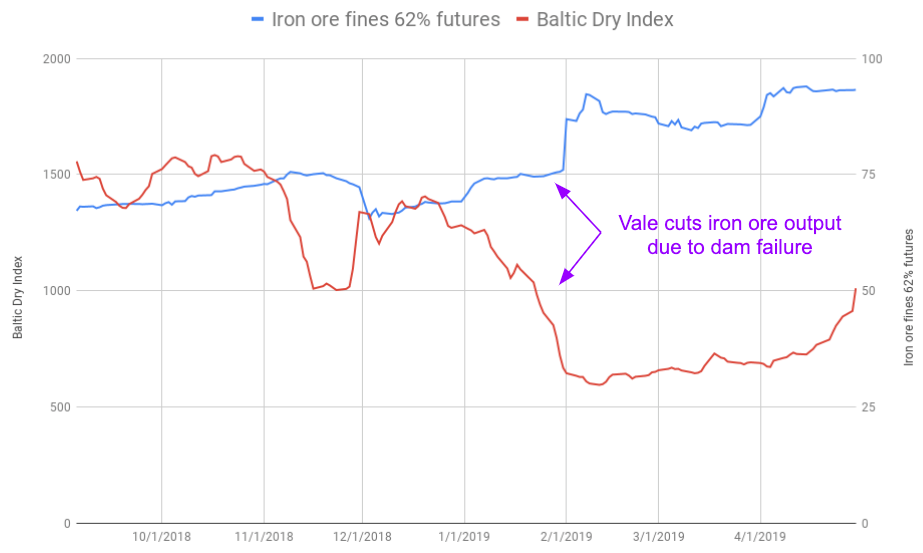
A quick glance below at historical Baltic Dry Index data and iron ore futures data from the CME Group tend to confirm this effect.
The chart clearly shows a divergence in prices for iron ore futures and the Baltic Dry Index shortly after the announcement that production at multiple iron ore mines in Brazil would be paused indefinitely.
Data courtesy of Investing.com. Iron ore fines 62% futures contracts available through CME Group.
This pause didn’t just impact prices but also vessel departure and destination patterns to and from Brazil.
For example, the orange line in the chart below shows Capesize and Panamax vessel departures to China dropping in early March 2019, presumably after most of the remaining iron ore inventory was cleared out of the supply chain and loaded onto ships bound for the C3 route to Qingdao.
The blue line shows vessel arrivals en route to Brazil started falling even earlier, around February 2019, or only a week after the dam failure.
Capesize and Panamax arrivals en route to Brazil and departures to China declined in early 2019
The timing difference in the decline of vessel departures and arrivals in the chart above is most likely due to the immediate negative impact on demand for ships into Brazil.
Similar effects can be seen in the drop of the Baltic Dry Index and the spike in iron ore futures that occurred at nearly the same time.
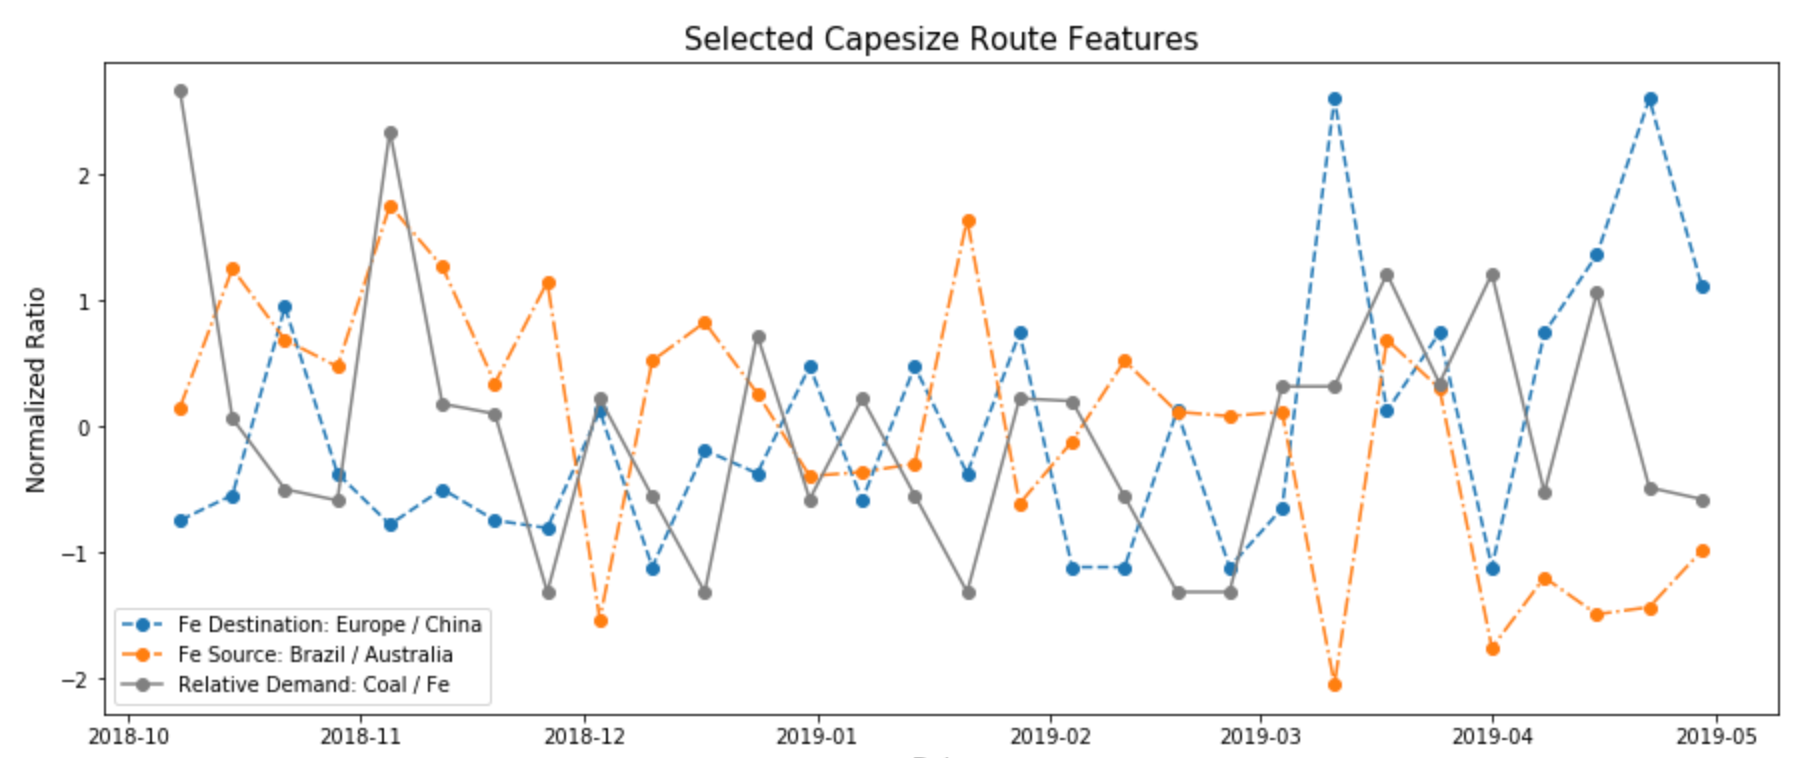
Weekly route volume information like this can be converted to features that can be used to build and test different price models.
The chart below includes several examples that could be constructed and fed into a machine learning model for iron ore.
In this case, the features being engineered include normalized weekly ratios of route volumes with a destination of either Europe or China and those with a source from Brazil or Australia.
In addition to route volumes, the relative demand between dry bulk cargos can also be represented as a feature.
These three features combined could be used to represent the primary fundamental model factors for the C3 iron ore route overall.
If you’d like to learn more about this factor model or discuss your interest in financial or operational modeling in general, feel free to get in touch with us here.
Until then, we’ll continue to expand our models of ocean transport and leave you with an appropriate sailor’s proverb:
“It is not the ship so much as the skillful sailing that assures the prosperous voyage.” — George William Curtis


No comments:
Post a Comment