Global trends in extreme (90th percentile) wind speed over the period 1985-2018.
Areas in red indicate increasing values, whereas blue indicates decreases.
Credit: Professor Ian Young
Global trends in extreme (90th percentile) wave height over the period 1985-2018.
Areas in red indicate increasing values, whereas blue indicates decreases.
Credit: Professor Ian Young, University of Melbourne
From DiscoverMag by Bill Andrews
In the world of climate science — and science in general — data is king.
The more of it you have, and the higher its quality, the better.
And while such trends as the rise in temperatures and sea levels have impeccable data behind them, not every measure of a changing climate has been so lucky.
Take the global wind and wave climate, for example, which measures trends in wind speed and wave height in oceans around the globe.
Both of these factors affect the interplay between the atmosphere and ocean of both energy and carbon (more winds equal choppier waters, which can get in the way of air-to-water energy transfers), and of course higher waves could spell more trouble during storm surges and affect flooding levels.
But it had been historically tricky to get reliable long-term data on these phenomena to study any possible trends.
Until now, that is.
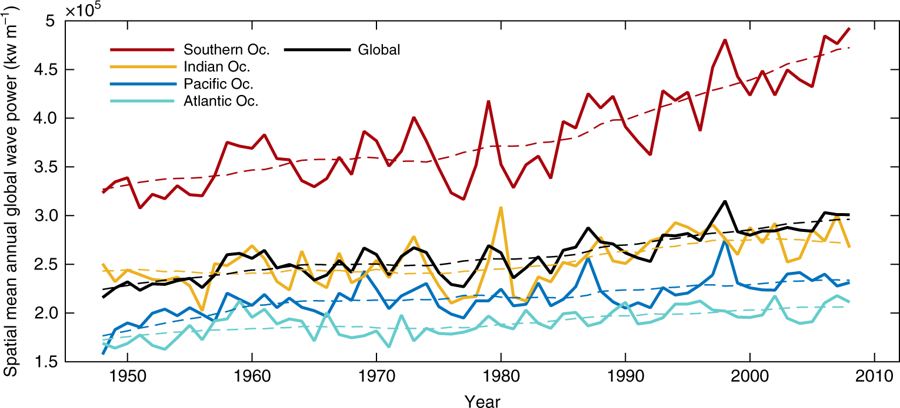
A paper in Science today uses satellite data to analyze wind speed and wave height over more than 30 years, and concluded that on average both are increasing, especially in the southern hemisphere, and especially during extreme conditions like storms.
They also demonstrated a useful way to study these things in the first place, which should prove helpful to scientists moving forward.
Image: Changes in wave power in different oceans over time, Nature.
Defective Data
Why did it take till now to amass and analyze what should be a fairly straightforward dataset?
As the paper’s authors explain, it wasn’t that easy.
Ocean buoys, “the most obvious data source,” have proven problematic because changes over the years in their construction and instrumentation mean the data they’re spitting out isn’t really consistent in the long term.
So it’d be comparing apples to, if not oranges, then at least other kinds of apples — not ideal.
Thus, they turned to the satellite record, which currently runs from 1985 through 2018.
Not bad, but the same worries came up there, too: With all the different kinds of hardware and software in space, maybe their data isn’t reliable enough for such research either?
So, the authors decided to go in and find out.
As you may have surmised by now, it worked out.
credit picture : Ameen Fahmy (unsplash.com)
Going Up
In particular, they studied the data collected by three kinds of instruments on satellites: altimeters, which measure both wave height and wind speed; radiometers, which measure wind speed; and scatterometers, which measure wind speed and direction.
After cross-checking all the numbers, cross-validating with other satellites and just generally making sure they weren’t being fooled by anything, the authors concluded that these past 30-odd years had seen a strong positive trend in global wind speed, and a weaker (but still noticeable) increase in wave heights.
They also noted the trends were much stronger in extreme cases, which they defined as the data from the set’s 90th percentile.
Not that any of the actual changes were especially high.
Wind speeds went up by about an inch per second every year — about twice the speed of a garden snail — across the Southern Ocean and south of the equator, where the trends were strongest.
The change was about half that in the North Atlantic.
(The extreme cases had the same distribution, but with faster speeds, around two inches per second per year.)
Things weren’t quite as clear cut for wave height, but there were patches with overall rises of about a tenth of an inch per year, and one surprising spot in the North Pacific with a drop of about half an inch per year.
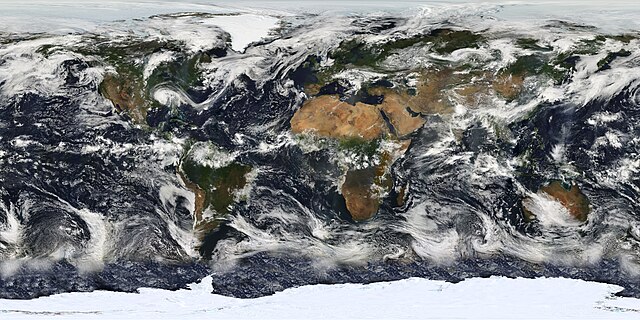
MODIS satellite image (21/05/2010)
Closing in on Climate
It might not sound like much, fractions of an inch here or there, but the results do show clear trends for global behavior over time.
Any improvement on our understanding of the global wind and wave climate is helpful, the authors write, since “estimates of future ocean wind and wave states, and whether extreme conditions are changing, are important elements of projections of total sea level.”
The team also showed that the satellites can be trusted, since each of the different kinds of instruments, aboard 31 total orbiting satellites, ultimately showed data consistent with each other.
This means future studies can rely on this increasingly rich data set without having to worry about comparing apples to anything else.
So not only did the authors add some specific bits of that all-important data to the global climate record, they also made it easier for future researchers to do the same.
Links :
- Oursuit : Ocean waves and winds are getting higher and stronger
- ScienceMag : The ocean’s tallest waves are getting taller
- The Guardian : World's oceans are becoming stormier, researchers discover
- Phys : 33-year study shows increasing ocean winds and wave heights
- NewScientist : Extremely fast winds and high waves are now happening more often


No comments:
Post a Comment