From Copernicus
Ships are responsible for ninety per cent of the worldwide transport of goods.
Playing such an important role in world trade and economy, the shipping industry needs to be able to predict how it will be affected by evolutions in the climate and to adapt accordingly.
This is where data from the Copernicus Climate Change Service (C3S), implemented by the European Centre for Medium-Range Weather Forecasts (ECMWF), come in.
Global climate datasets relevant to the shipping industry are being bundled into a Global Shipping Service to aid decision-making and support medium- and long-term planning.
The shipping industry is influenced both positively and negatively by climate change.
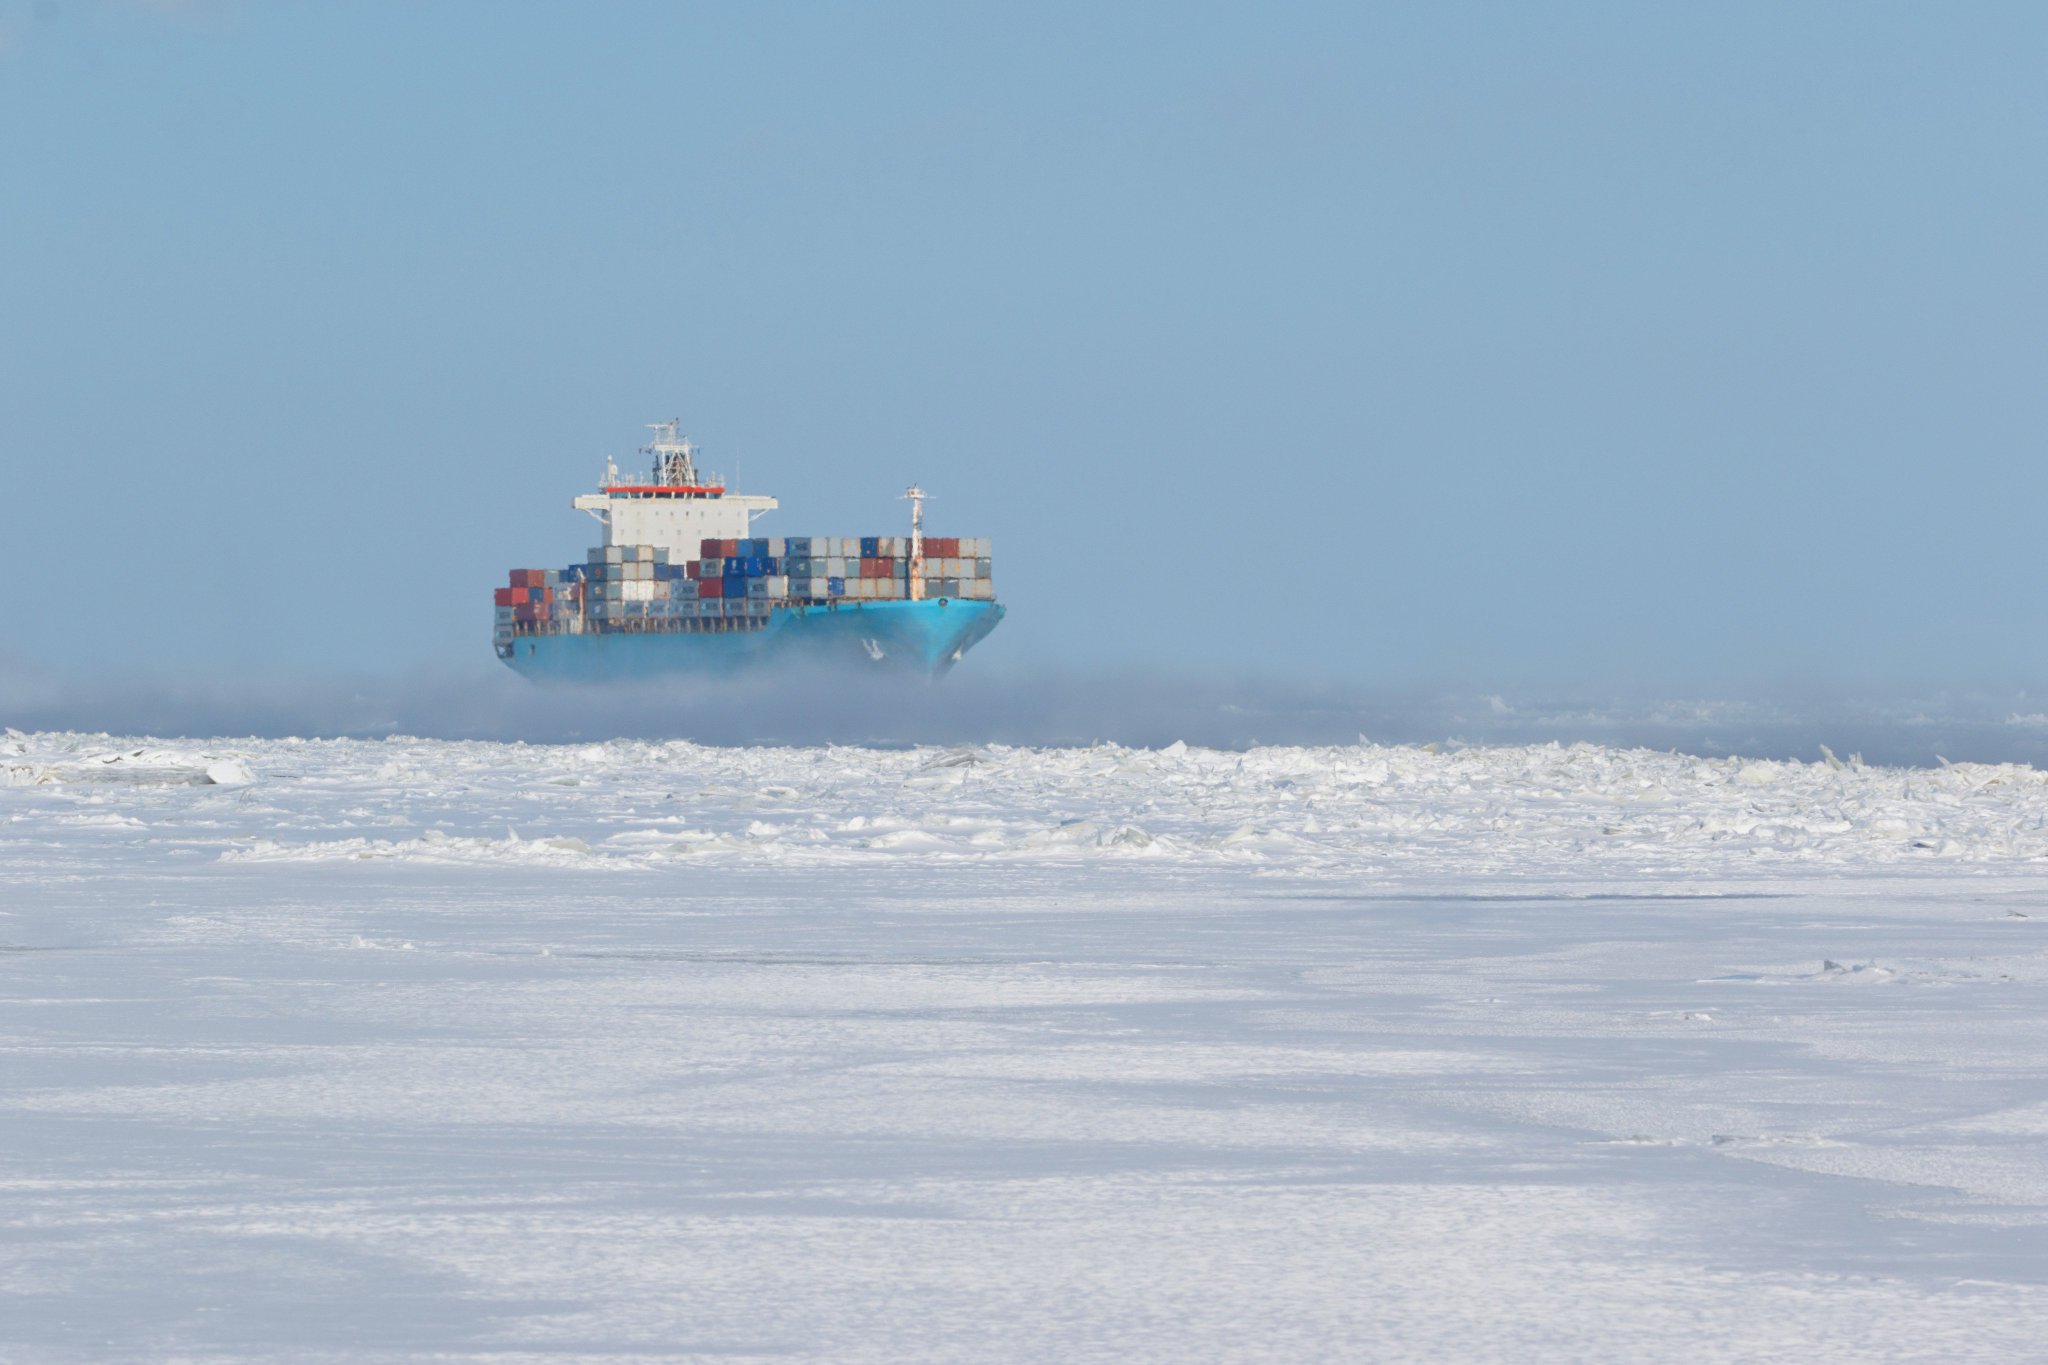
Increases in tropical storms and ocean temperatures can pose problems for ships, but rising sea levels allow larger ships to enter harbours that were previously too shallow, and melting ice makes it much easier for ships to traverse the Arctic.

The Northwest and Northeast Arctic Passages.
The opening of the Northeast passage is interesting for Europe.
Credit: Susie Harder, Arctic Council
Credit: Susie Harder, Arctic Council
When the Arctic passage is open, the time required to travel between parts of Europe and Asia is significantly reduced, decreasing the fuel usage and associated emissions.
Not only is this good for the environment, it also reduces operational costs – potentially leading to reduced prices for customers.
The industry is extremely interested in the opening of the route, although there are ethical questions surrounding sending ships to the Arctic.
Oil spillages, for example, pose huge dangers for the Arctic environment, and clearing pathways by breaking-up ice speeds up the melting process.

Overview of the arctic route availability application.
The dotted red line represents the standard north-east passage route.
The white region is the average ice coverage for the selected month and year.
The bar plot depicts the time window during which the standard north-east passage route is considered navigable.
Different shades of green correspond to different route availability thresholds, i.e. the ratio between the ice-covered distance and total navigation distance.
C3S is currently working with a variety of contractors, including Offshore Navigation, who are developing the Global Shipping Service.
“This is the first service that allows the industry to see how the climate will affect shipping routes,” explains Carlo Buontempo, who oversees the project on behalf of C3S.
“Several companies have already expressed their interest in using the service when it is up and running.”

Overview of the shaft power application.
The map shows the average wind speed and wave contours, as well as the selected shipping route.
The percentile plot shows the required shaft power along the route to maintain the selected ship type at the selected speed over ground.
The Global Shipping Service will include a variety of tools to help the industry, including:
An Arctic route model that estimates the number of days per year that a given route will be available, based on projected ice conditions in the Arctic.
A fuel consumption model that calculates the impact of meteorological and oceanic conditions on set routes, as well as the seasonal forecast of the cost of a route.
An iceberg drifting model that defines areas containing icebergs, helping ships to navigate the northern oceans.

The drifting of very large icebergs from northern Canada into the open ocean, during which time they also shrink. The yellow colour symbolises icebergs that are ten times larger than those symbolised by the purple colour.
Credit: The C3S for Global Shipping Project Team
The Global Shipping Service uses many different types of data, including raw observations, seasonal predictions and climate projections.
C3S provides information on the wind, waves, ocean current, sea surface pressure and temperature, and ice thickness and concentration.
All of this information is publicly available via the Climate Data Store.

Exciting opportunities for new trade routes?
Last month, Maersk, one of the world’s largest logistics firms, sailed a cargo ship from Asia to Europe through a route north of Russia for the first time.
courtesy of GeoPoliticalFeatures
The Global Shipping Service will be built around a web application including a world map with predefined routes and charts of the essential climate variables most relevant to the shipping industry.
Kris Lemmens from Offshore Navigation explains further, “A menu allows users to select the month of interest, the desired variables to be represented, and the time scale. The user selects a route and sees their chosen climate variables plotted along that route on the map.”
The C3S data are available on three different time scales ranging from months to decades. This assists the industry with both short- and long-term planning and investment.”

Data from ECMWF showing the percentage of waves that are higher than 3.5 metres across the world.
The Global Shipping service uses this kind of data to help their users plan shipping routes.
Credit: ECMWF
Credit: ECMWF
Once these tools are ready for use, the team would like to expand their services with statistics related to cargo loss, ship hull stress and the accumulation of small plants and animals on the ship.
They are also considering a function that allows users to create their own routes.
“The development of this service would not have been possible were it not for the variety of skills and knowledge brought in by the different contractors,” concludes Lemmens.
“We are delighted that we have been given the opportunity to work on a project with such high importance and relevance to the world economy, and we are certain that this will be a fantastic service for the community.”
Links :
- C3S : a quick introduction / Copernicus Climate Change Service (C3S)
- GeoGarage blog : Copernicus Sentinel-3 offers safer navigation at sea / Copernicus Marine Service / Sentinel satellite exposes sulphur dioxide pollution / Copernicus ocean currents /
Copernicus Sentinel-1 : making our seas safer / Sentinel tracks ships' dirty emissions from orbit / Sentinel's first map of sea-surface 'hills and valleys'
BBC : Is the Arctic set to become a main shipping route?
ReplyDelete