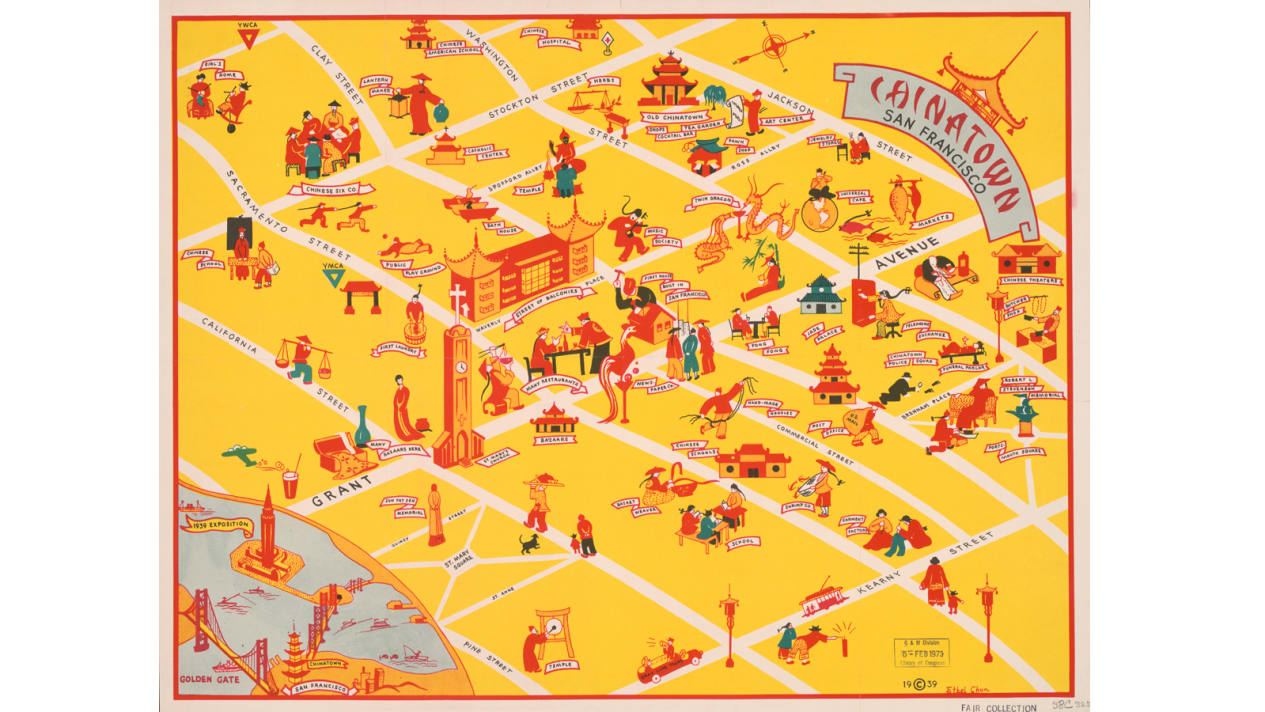
Every Chinatown is regarded as a place of mystery and intrigue, but San Francisco's version is probably the most elusive of all.
This map by artist Ethel Chun uses a traditional Chinese color scheme to try and explain the chaos of Chinatown to the average American tourist.
From CNN by Marianna Cerini
For millennia, maps have held talismanic powers, helping to form spatial concepts and advance exploration.
They have shaped geopolitical ideas, triggered international disputes and created pictures of the world both large and detailed.
Today, satellites and digital mapping tools have turned modern cartography -- the science and art of map-making -- into a technology-driven field.
With accuracy all but guaranteed, new ways of visualizing space have emerged in the process.
They mix art, experience and topography, approaching the physical world through the lens of time, perspective and storytelling.
Qiu Zhijie: China's master mapmaker
Artist Qiu Zhijie discusses his diverse artistic career and how his practice of drawing maps unites different aspects of his work.
He also describes his newly commissioned work "Map of 'Art and China after 1989: Theater of the World'” (2017), which traces “several decades of contemporary Chinese art.”
"We've entered a new era for cartography," Zhou Qiming, a professor and director of the Centre for Geo-Computation Studies at Hong Kong Baptist University, said in a phone interview.
"Previously, map-making focused solely on projecting the Earth and its sphericality on a flat plane.
That's taking a less crucial role now.
"We're approaching geographical environments from different directions, and (finding) ways of presenting geospatial locations that aren't maps in the traditional sense, but rather map-like visualizations.
It's no longer just about a spatial display, although that remains the main reference point for any cartographer.
Maps are getting smarter, and showing us the world under different parameters."
From Babylon to GPS
The earliest known maps were, given the limited knowledge of their creators, produced as artistic expressions rather than accurate representations.
The "Babylonian Map of the World," a clay tablet created in Mesopotamia around 700 to 500 B.C., depicts Babylon as the center of the known world ringed by a circular waterway labelled "Salt-Sea" and surrounded by eight triangular regions.
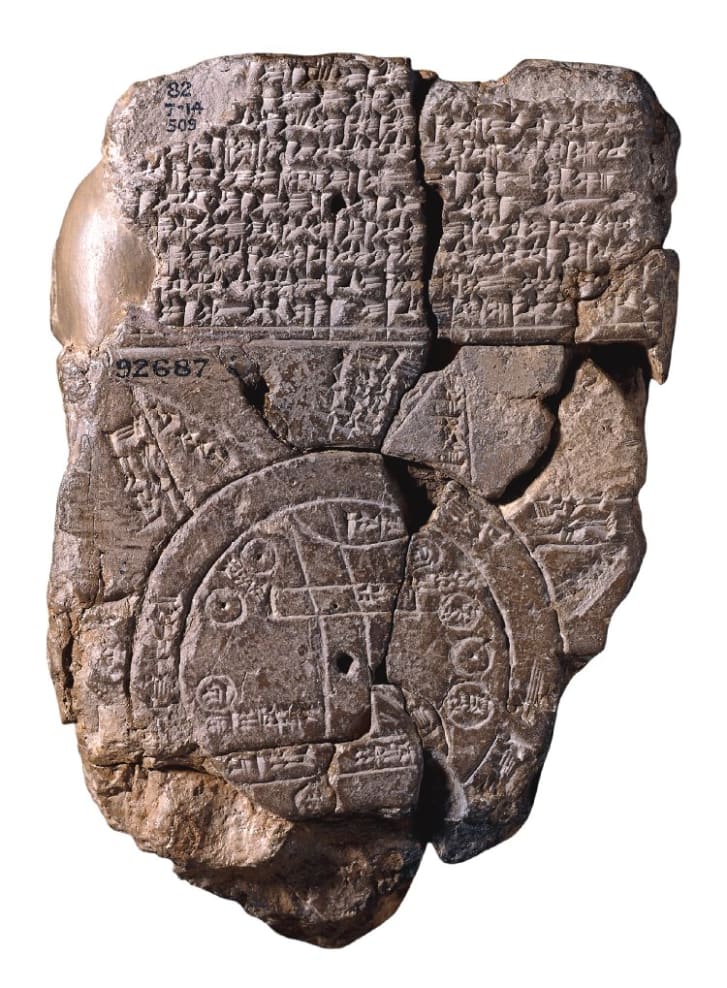
The "Babylonian Map of the World," a clay tablet created in Mesopotamia around 700 to 500 B.C., shows the known world ringed by a circular waterway labelled "Salt-Sea" and surrounded by eight triangular regions.
Credit: Courtesy of The British Museum
Map-making took a turn for the realistic in the second century, when Greek scholar Claudius Ptolemy used math and geometry to devise a system of latitude and longitude for almost 10,000 locations in Europe, Asia and North Africa.
But even as cartography became an increasingly accurate science, maps were often more concerned with cultural traditions, storytelling and religious views.
A 12th-century map by the Islamic scholar Al-Sharif al-Idrisi portrayed a world with south at its top (as that's where Mecca was), with the northern hemisphere divided into seven climatic zones.
In the Middle Ages, the so-called "mappa mundi" often organized the world according to biblical time, with Christ looming over Jerusalem at their center.
Cartography made a technological leap during World War I with the development of aerial photography.
Then came radars and GPS, as maps moved into the digital sphere.
Through this technology, our understanding of maps has changed entirely, according to Eric Gunderson, CEO of Mapbox, a platform that provides mapping tool to companies like Foursquare, Evernote and Snapchat.
"They are instantly available, customized, interactive," he said in a phone interview.
"And users are at the center of them: We can make specific maps that aggregate elements we are interested in, and discard those we find irrelevant.
Maps compile data, but also behaviors and human experiences."
Alternative cartography
This may account for the future of cartography as a science, but what about map-making as an art?
Good City Life, a collective of researchers with no background in cartography, has been making maps according to how people feel about their cities.
"We've approached map-making from a different set of metrics," said co-founder Daniele Quercia in a phone interview.
"Taking into consideration things like sensory data, emotions, beauty (and) visual pleasure.
Maps aren't just two-dimensional."
Smelly maps, taking one's nose as a big data machine, capture the entire urban smellscape from social media data.
Smelly maps, taking one's nose as a big data machine, capture the entire urban smellscape from social media data.
Credit: Courtesy Good City Life
One of the resulting cartographies is Happy Maps, a series of online maps that use algorithms to sort through geotagged images and calculate the most scenic routes.
Another is Chatty Maps, a project that documents what people hear on the streets and considers how soundscapes influence their perception of their environments.
Each map is color-coded, with noises rendered in different hues.
Smelly Maps, a third experiment by Good City Life, works on a similar premise, but focuses on tracking smells.
"Maps can improve people's lives," Quercia said.
"Today, they can be conceived to work around people's psychologies and to convey experiences."
Smells also underpin the maps made by Kate McLean, program director for graphic design at the UK's Canterbury Christ Church University.
Her charts guide people on city walks -- or "smellwalks" -- after which she gathers their olfactory impressions and uses them to visualize the "smellscape."
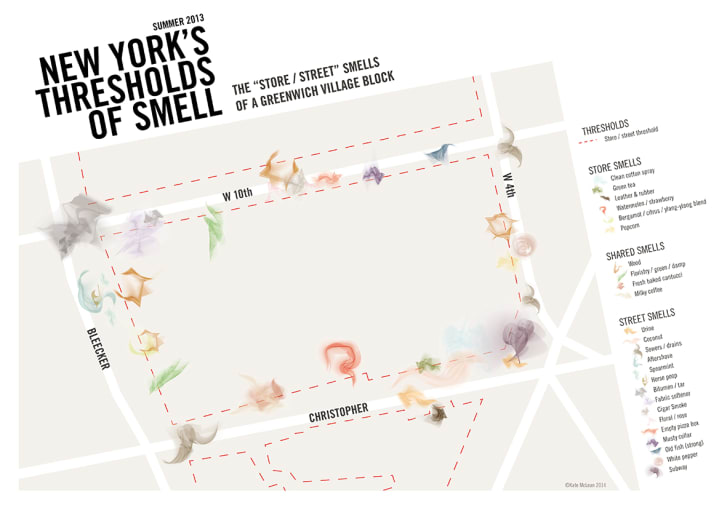
"New York's Thresholds of Smell" shows an exploration of the smells found in the doorways and windows of a Greenwich Village Block in the summer of 2013.
"I was intrigued by how it could help us understand the world we live in
"I base all my work on physical experiences, rather than algorithms," she added.
"Mine is certainly an artistic kind of cartography, but I am intrigued by how maps can maybe bring alternative realities into being, rather than presenting a fixed record of things."
Creating 'personal geographies'
Chelsea Nestel, a PhD student specializing in cartography at the University of Wisconsin-Madison, thinks of modern map-making in similar terms.
"The first rule of geography is that everything is related to everything else," she said in a phone interview.
"Today's cartography reflects exactly that: It combines design, geography, anthropology, human impressions and ideas within spatial contexts.
It's a connector, an aggregator.
And, increasingly, it's a way of telling stories."
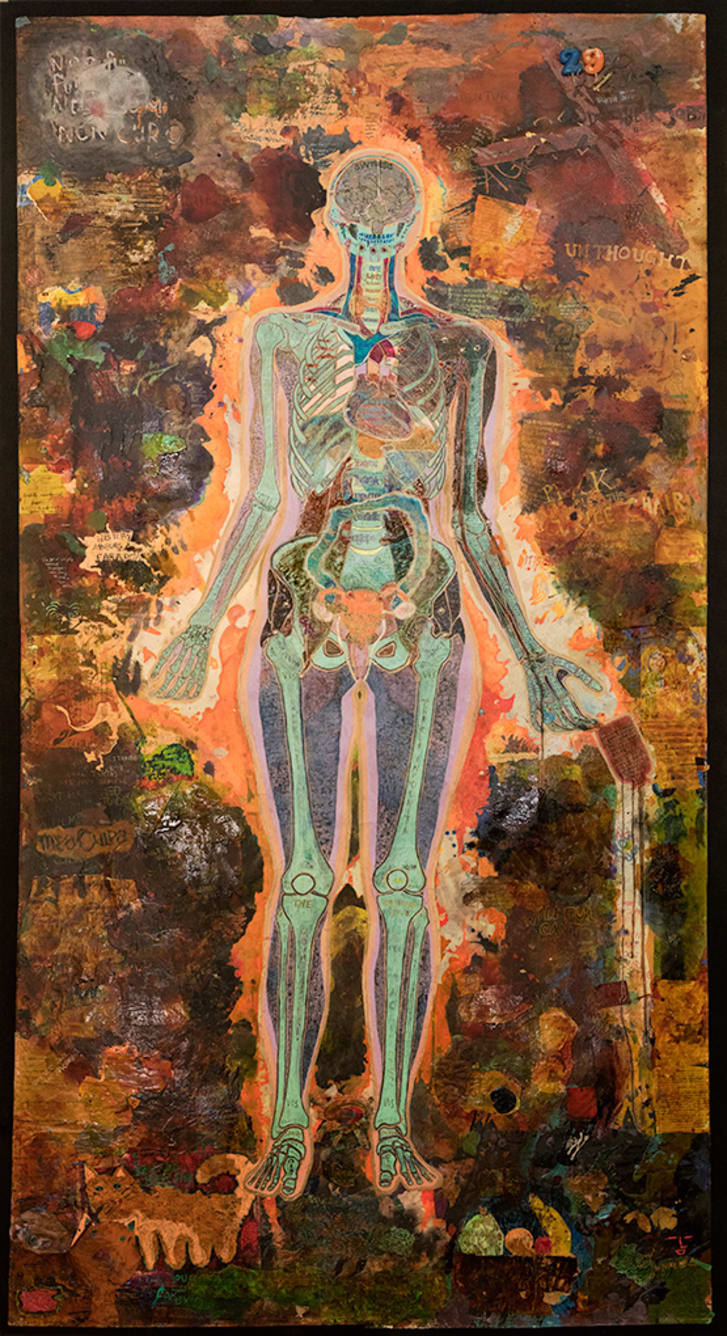
Nestel produced a one to one scale scientific map of her body based on radiography and research.
The cartographer also used collaged memories to create a personal map of emotions.
Credit: Courtesy Chelsea Nestel
Nestel's creations span graphic design, comics and traditional mapping techniques.
One of her hand-drawn creations shows the territories of the United States according to the mythical beasts and monsters that supposedly inhabit them.
Another presents the world through the flow of tweets that followed earthquakes in Haiti, Chile, Japan and Turkey between 2010 and 2011.
Her most personal map, titled "Sum," is a depiction of her own body based on X-ray scans, blended with a collage of words and personal memories.
"Mapping tools are so advanced that there's no really limit to what maps can show and do," she said.
"And that includes exploring emotions and subjectivity."
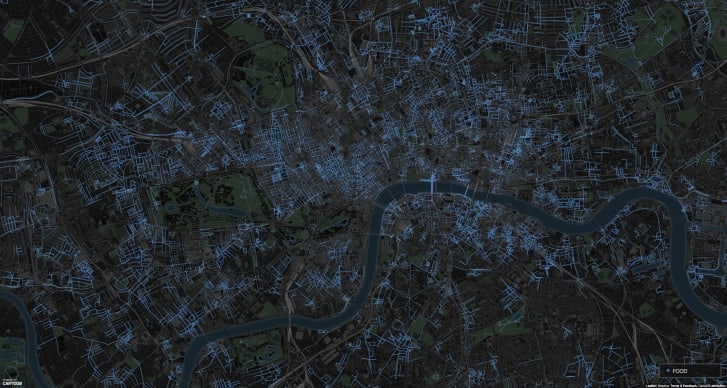
Welsh-born artist Gareth Wood, who goes by the name Fuller, borrows the tools of cartography to create geo-pictorial maps of world cities and present "the sense of a place." His huge, detailed artworks depict landmarks alongside pop culture symbols and other curiosities.
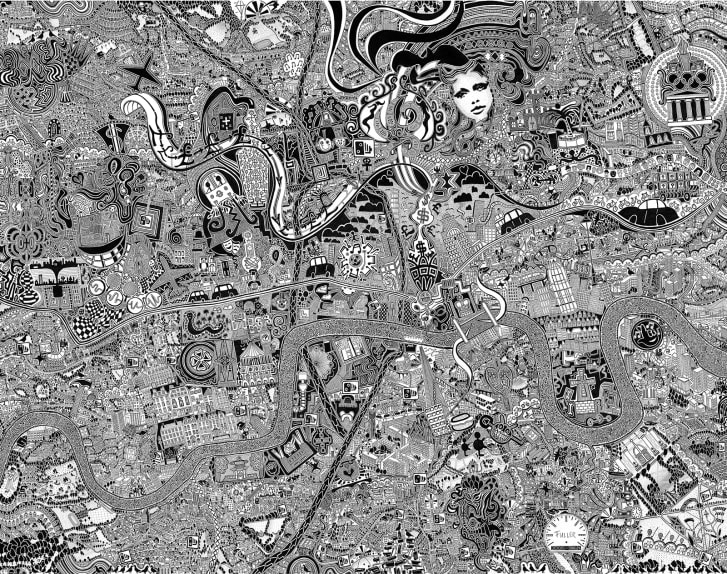
Artist Fuller charted the changing structures of London between 2005 and 2015.
Credit: Courtesy Fuller
"My maps blend my personal experiences with the culture and society of the place I am in," he said in a phone interview.
"They are snapshots of what I feel or see."
To create his most recent work -- a map of Beijing, where he is currently based -- Fuller circumnavigated a 140-kilometer outer-city ring road, before sitting down to sketch.
"Wandering helps me understand the people, as well as the different economic, environmental and social strata I need to represent," he said.
"I'm not a traditional map-maker.
But I create personal geographies and observe human stories, and isn't cartography supposed to be doing that?"
No comments:
Post a Comment