
Colorful lines on a nautical chart aboard the Tenyo hydrographic survey vessel show trajectories surveyed by its dinghy.
Black lines indicate trajectories yet to be surveyed.
(Yosuke Fukudome)
From TheAsahiShimbun by Yuri Imamura
About an hour into a Japan Coast Guard hydrographic survey mission, a crew member on lookout abruptly shouted for the dinghy to stop.
The starboard was about to touch a 200-meter-long rope floating about 1 meter beneath the sea surface near Onagawa Port, Miyagi Prefecture.
The rope was being used for an underwater operation to tie a work vessel to a buoy.
The previous day, the crew discovered about 10 caissons, the gigantic concrete boxes that constitute the foundations of a breakwater, in the area.
The boxes, measuring 20 meters per side and each weighing several thousand tons, were dumped there by the tsunami three and a half years ago.
“Even those hefty caissons were swept up by the tsunami,” said Tsuyoshi Takaesu, the chief hydrographic surveyor of the main Tenyo survey vessel.
“You will never know what you will encounter.”

A dinghy of the Tenyo, a hydrographic survey vessel of the Japan Coast Guard,
navigates Onagawa Bay. (Yosuke Fukudome)
The Japan Coast Guard continues to survey waters off the tsunami-affected Tohoku coast to revise nautical charts that take into account disaster-related rubble on the seabed, drifting objects and changing water depths that could pose a threat to safe navigation.
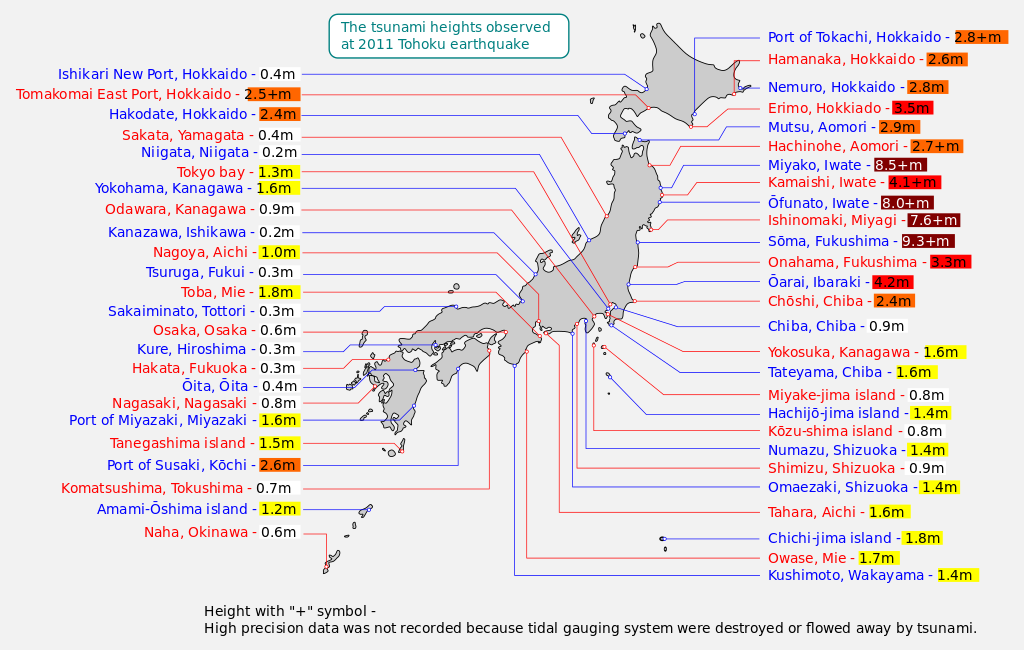
Map of 2011 Tohoku(Sendai) earthquake observed tsunami heights in Japan.
The mission primarily covers 24 ports and surrounding waters along the Pacific coast extending from Aomori Prefecture to Ibaraki Prefecture and is scheduled to be completed by the end of fiscal 2015.
The 2011 disaster caused changes to the seafloor on an unprecedented scale, Coast Guard officials said.
And the mission so far has been full of surprises and potential dangers.
“A big mess would follow if (the rope) were to be caught in the dinghy’s propeller,” Takaesu said in a strained voice about the rope.

This image, obtained during the Tenyo’s seabed survey immediately following the Great East Japan Earthquake and tsunami, is believed to represent a submerged vehicle.
(Provided by the Second Regional Coast Guard Headquarters)
The dinghy’s crew approached carefully and used a pole to get the rope out of the way.
The compact dinghy, which is only 2 meters wide and 10 meters long, was deployed from the 430-ton Tenyo survey vessel on Sept. 17 to survey the shallow interior of the port.
The Tenyo, with a crew of 23 and Koichi Nishimura as captain, was surveying all parts of the harbor off the town of Onagawa for the first time in 32 years.
Takaesu, 50, has served in the post since immediately after the Great East Japan Earthquake triggered the tsunami on March 11, 2011.
The tsunami changed water depths significantly in nautical charts in at least one location for every harbor, according to officials of the Second Regional Coast Guard Headquarters, which oversees the coasts of the six Tohoku prefectures.
The Changing Face of Onagawa (March 11, 2011 - March 11, 2013)
Nautical charts show water depths, coastal topography, locations of shoals and lighthouses, ocean flows and tide currents to ensure safe navigation of seafaring vessels and port use.
The new nautical charts will be used to set limits on the size of vessels and their cargo to ensure that seabed objects will not hit the ship bottoms.
Takaesu recalled the time he was in Kamaishi Port in Iwate Prefecture in May, when he came across a spot with a depth of only 1 to 2 meters, despite surrounding depths of 36 meters.
When he hastily brought out measurement equipment, he saw something in the water that looked like Tokyo Tower.
“What’s this?” he thought, and returned to the same spot.
He realized the object was a mess of entangled fishing nets.
“It gave me a shudder to realize that an object like that was still moving along,” Takaesu said. “Rebuilding efforts have proceeded visibly on land, but they probably still have a long way to go in the ocean.”

This image is believed to represent a submerged vessel.
(Provided by the Second Regional Coast Guard Headquarters)
The dinghy can accommodate 10, but only five or six usually go on board because of the small interior.
A monitoring chamber in the center of the dinghy contains four computer monitors.
A multi-beam sonar on the bottom measures the seafloor topography and produces graphical output.
The constant movement of the dinghy can induce sea sickness.
“I have yet to get accustomed,” said Kenta Kobayashi, a 21-year-old rookie who was assigned to do hydrographic surveys in spring.
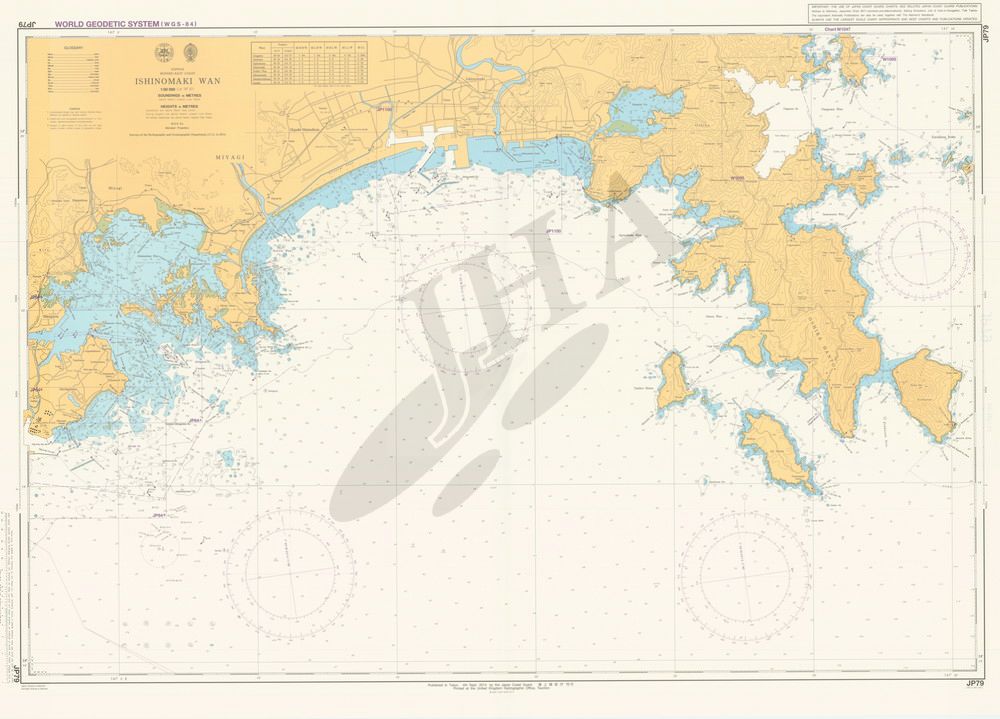
JP79 Ishinomaki Wan (1:50,000) published 2014-09
JHA/Japan Coast Guard
JHA/Japan Coast Guard
The dinghy shuttled back and forth at a speed of 8-9 kph within a radius of about 100 meters near a tsunami breakwater under construction 1 km off Onagawa Port.
It shifted its trajectory slightly to one side each time, just as you do when you wipe a floor with a cloth.
“We are passing by the caissons,” Kobayashi said as the dinghy entered the waters where the objects had been spotted the previous day.
When the depths became shallower, the computer screens shifted from deep blue to orange.
Koji Saito, a 25-year-old assistant hydrographic surveyor, said he was working for the Second Regional Coast Guard Headquarters in Shiogama, Miyagi Prefecture, when the quake and tsunami struck.
He said he found a swept-up passenger car in Hachinohe Port, Aomori Prefecture.
“Whenever I am on a survey mission, I can’t help but look for a car that may contain missing people,” Saito said.
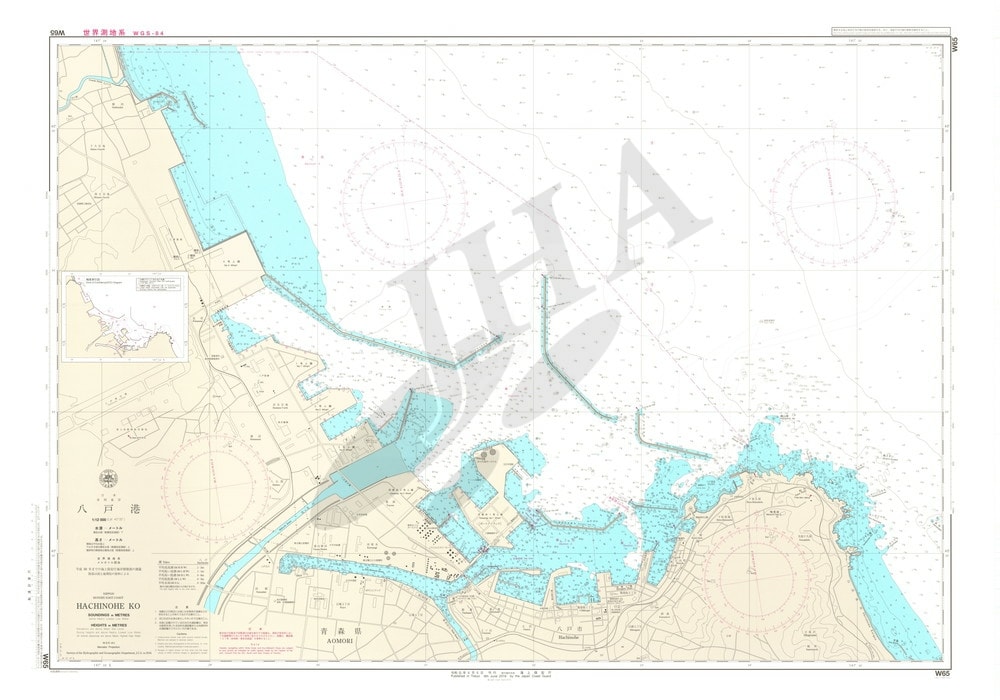
W65 Hachinohe Ko (1:12,000) published 2014-03
JHA/Japan Coast Guard
Tsunami breakwaters were destroyed in the ports of Ofunato and Kamaishi in Iwate Prefecture, where water depths lost a maximum of 10 meters.
But in a July 2011 survey, the water was 15 meters deeper than indicated in the nautical chart at one location in Hachinohe Port, Aomori Prefecture.
It is believed that the tsunami induced a big eddy that scooped out part of the seafloor.
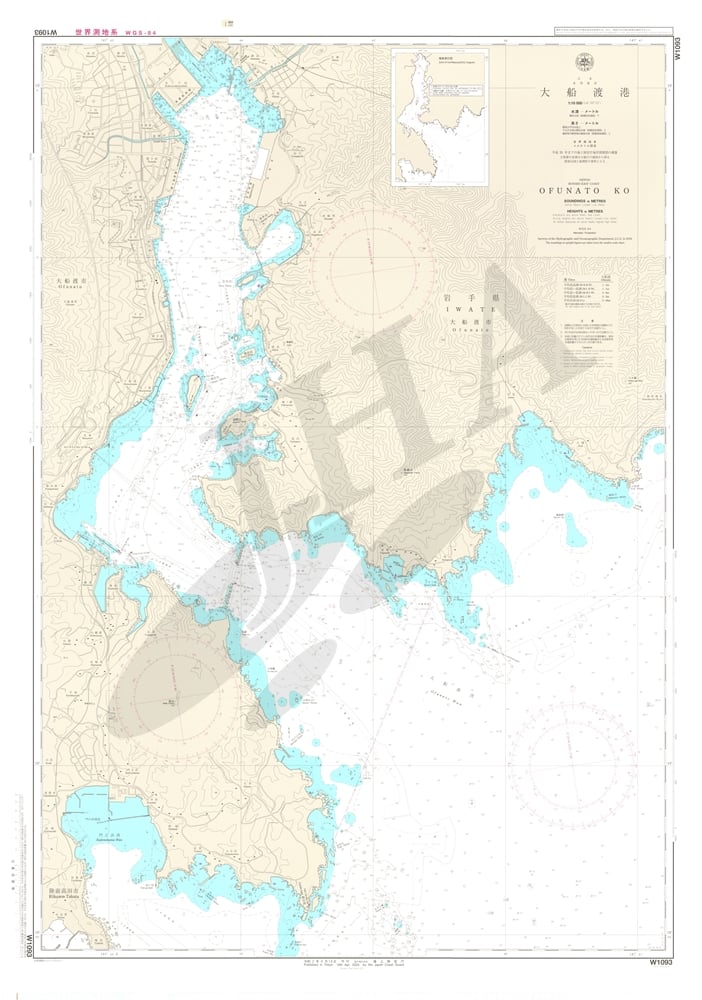
W1093 Ofunato Ko (1:10,000) published 2014-07
JHA/Japan Coast Guard
Coast Guard officials said local governments that administer ports are in charge of surveying any small changes, such as those resulting from wharf construction.
The Coast Guard uses those survey results to modify its nautical charts.
But the 2011 disaster created so many changes that the Coast Guard took the unusual step of conducting comprehensive surveys and republishing nautical charts for all 24 ports affected.
It takes workers two to eight weeks to survey a single harbor.
They work in three shifts around the clock.
Data analysis requires an additional six months to one year.
“There is a pressing need for port maintenance to help rebuilding efforts,” said Hirokazu Mori, the 47-year-old chief of the hydrographic surveys division in the Second Regional Coast Guard Headquarters.
“We hope to produce highly reliable nautical charts.”

Japan’s first nautical chart was created in 1872 by the navy and covered Kamaishi Port.
Vessels of a certain dimension are legally obligated to equip themselves with nautical charts on a permanent basis.
Links :
- Hydro : Hydrography After Huge Earthquakes (2011)
No comments:
Post a Comment