
Increases in temperature, sea level and CO2 observed; Southern Hemisphere warmth and Super Typhoon Haiyan among year’s most notable events
In 2013, the vast majority of worldwide climate indicators—greenhouse gases, sea levels, global temperatures, etc.—continued to reflect trends of a warmer planet, according to the indicators assessed in the State of the Climate in 2013 report, released online today by the American Meteorological Society.
Scientists from NOAA’s National Climatic Data Center in Asheville, N.C., served as the lead editors of the report, which was compiled by 425 scientists from 57 countries around the world (highlights, visuals, full report).
It provides a detailed update on global climate indicators, notable weather events, and other data collected by environmental monitoring stations and instruments on air, land, sea, and ice.
“These findings reinforce what scientists for decades have observed: that our planet is becoming a warmer place,” said NOAA Administrator Kathryn Sullivan, Ph.D. “This report provides the foundational information we need to develop tools and services for communities, business, and nations to prepare for, and build resilience to, the impacts of climate change.”
The report uses dozens of climate indicators to track patterns, changes, and trends of the global climate system, including greenhouse gases; temperatures throughout the atmosphere, ocean, and land; cloud cover; sea level; ocean salinity; sea ice extent; and snow cover.
These indicators often reflect many thousands of measurements from multiple independent datasets.
The report also details cases of unusual and extreme regional events, such as Super Typhoon Haiyan, which devastated portions of Southeast Asia in November 2013.
Highlights:

Atmospheric carbon dioxide concentrations in parts per million for the past 800,000 years, with the 2013 annual average concentration as a dashed line.
The peaks and valleys in carbon dioxide levels follow the coming and going of ice ages (low CO2) and warmer interglacials (higher CO2).
Graph by NOAA Climate.gov, based on EPICA Dome C data (Lüthi, D., et al., 2008) provided by NOAA NCDC Paleoclimatology Program.
- Greenhouse gases continued to climb: Major greenhouse gas concentrations, including carbon dioxide (CO2), methane and nitrous oxide, continued to rise during 2013, once again reaching historic high values. Atmospheric CO2 concentrations increased by 2.8 ppm in 2013, reaching a global average of 395.3 ppm for the year. At the Mauna Loa Observatory in Hawaii, the daily concentration of CO2 exceeded 400 ppm on May 9 for the first time since measurements began at the site in 1958. This milestone follows observational sites in the Arctic that observed this CO2 threshold of 400 ppm in spring 2012.

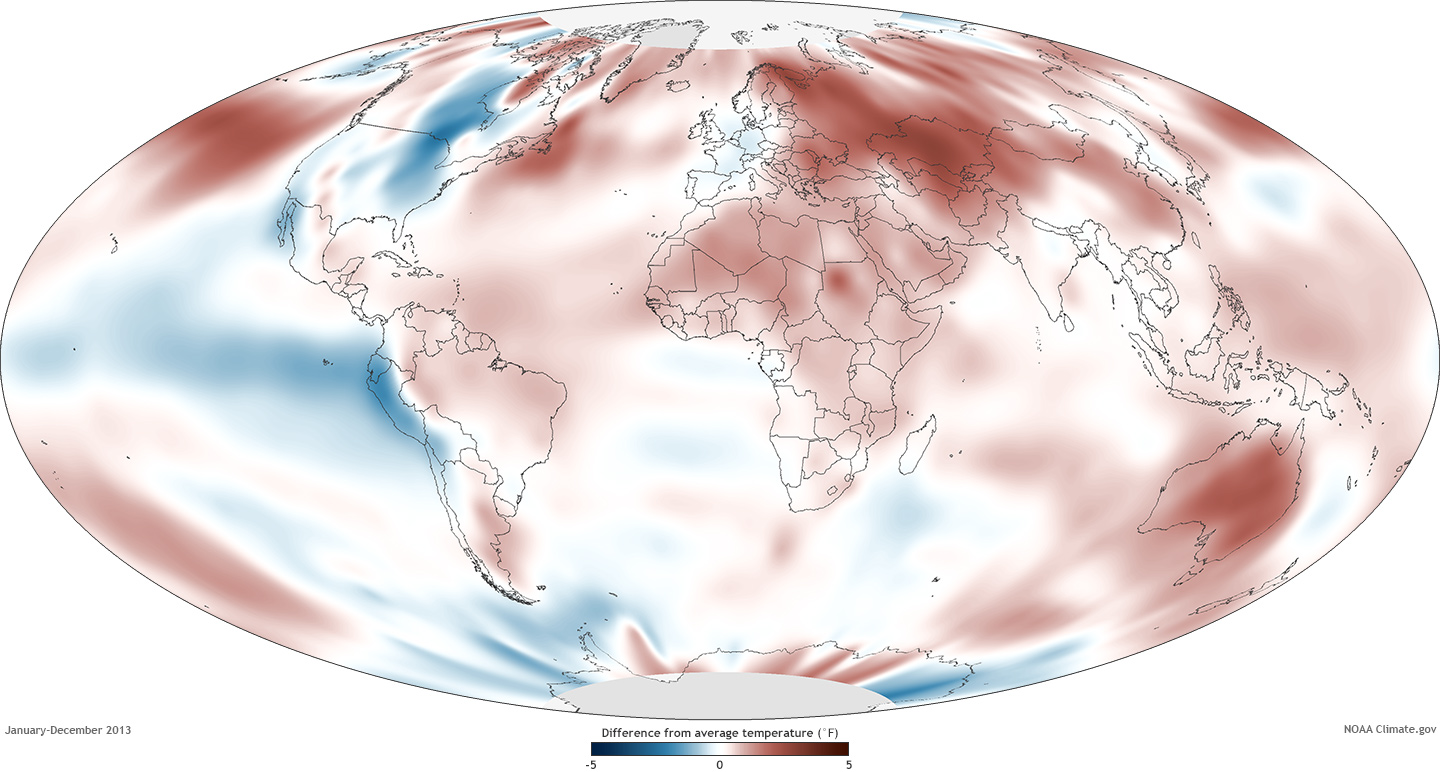
Surface temperatures in 2013 compared to the 1981-2010 average. NOAA map by Dan Pisut, NOAA Environmental Visualization Lab, based on Merged Land and Ocean Surface Temperature data from the National Climatic Data Center. Adapted from Plate 2.1(c) in State of the Climate in 2013.
- Warm temperature trends continued near the Earth’s surface: Four major independent datasets show 2013 was among the warmest years on record, ranking between second and sixth depending upon the dataset used. In the Southern Hemisphere, Australia observed its warmest year on record, while Argentina had its second warmest and New Zealand its third warmest.
Annual sea surface temperature compared to the 1981-2010 average from a variety of sources. Despite year to year variability, all the years in the past decade have been warmer than average.
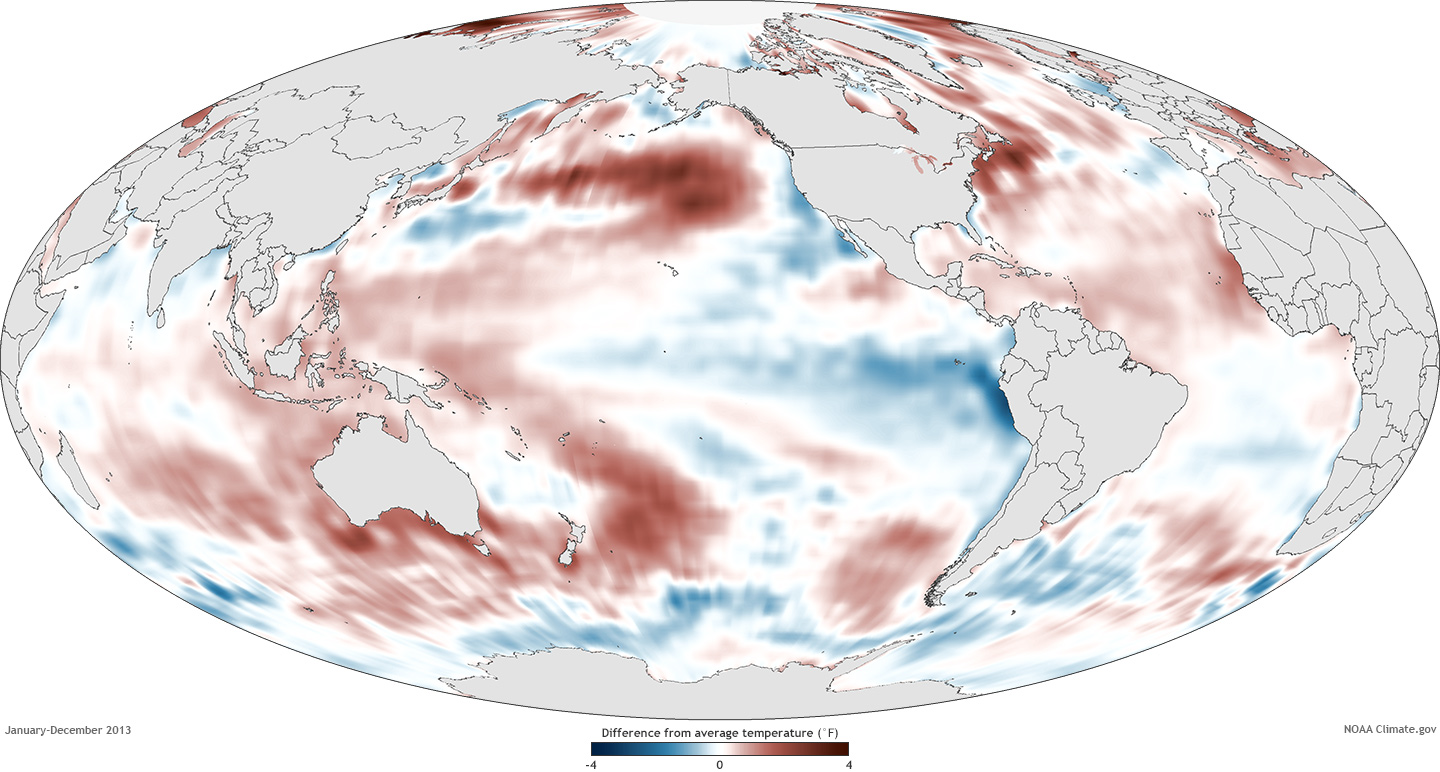
Sea surface temperature in 2013 compared to the 1981-2010 average.
The dark red and blue areas reveal areas of the global ocean that were up to 4º Fahrenheit warmer or cooler than average.
Map by Dan Pisut, based on NOAA OISST data. Adapted from Figure 3.1(a), in State of the Climate in 2013.
- Sea surface temperatures increased: Four independent datasets indicate that the globally averaged sea surface temperature for 2013 was among the 10 warmest on record. El Niño Southern Oscillation (ENSO)-neutral conditions in the eastern central Pacific Ocean and a negative Pacific decadal oscillation pattern in the North Pacific. The North Pacific was record warm for 2013.

Global sea level from 1993 through 2013 compared to 1993-2012 average, based on AVISO data. Graph adapted from Plate 1.1, panel v, in State of the Climate in 2013.
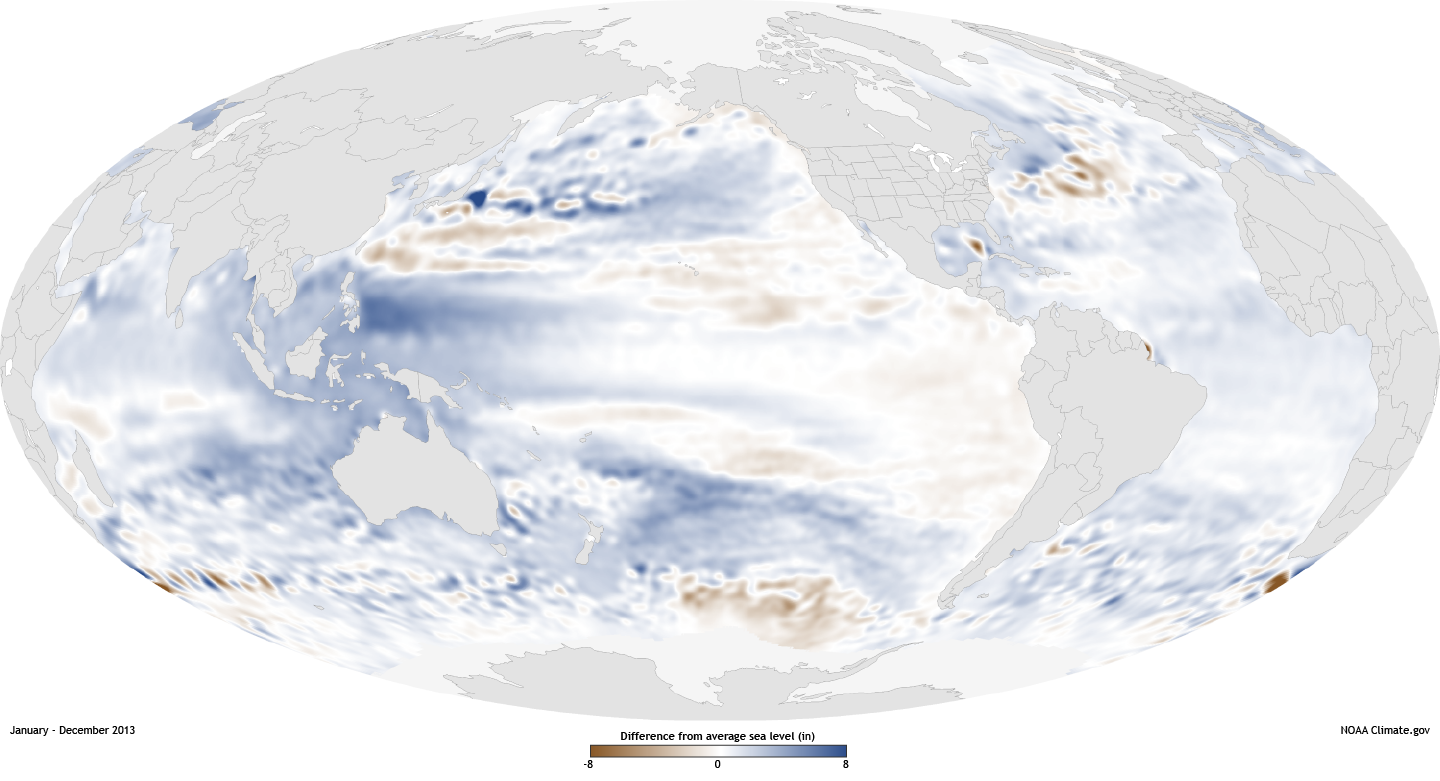
Places where sea level rose up to 8 inches higher than the 1993-2010 average are dark blue, average levels are white, and places where sea level fell below average are brown.
Map by NOAA Climate.gov, based on AVISO data provided by Mark Merrifield.
Adapted from Figure 3.28(a) in State of the Climate in 2013.
- Sea level continued to rise: Global mean sea level continued to rise during 2013, on pace with a trend of 3.2 ± 0.4 mm per year over the past two decades.

Difference in ice extents for each year’s maximum (March, purple line) and minimum (September, blue line) relative to the 1981-2010 average.
Graph adapted from Figure 5.13 in State of the Climate in 2013.
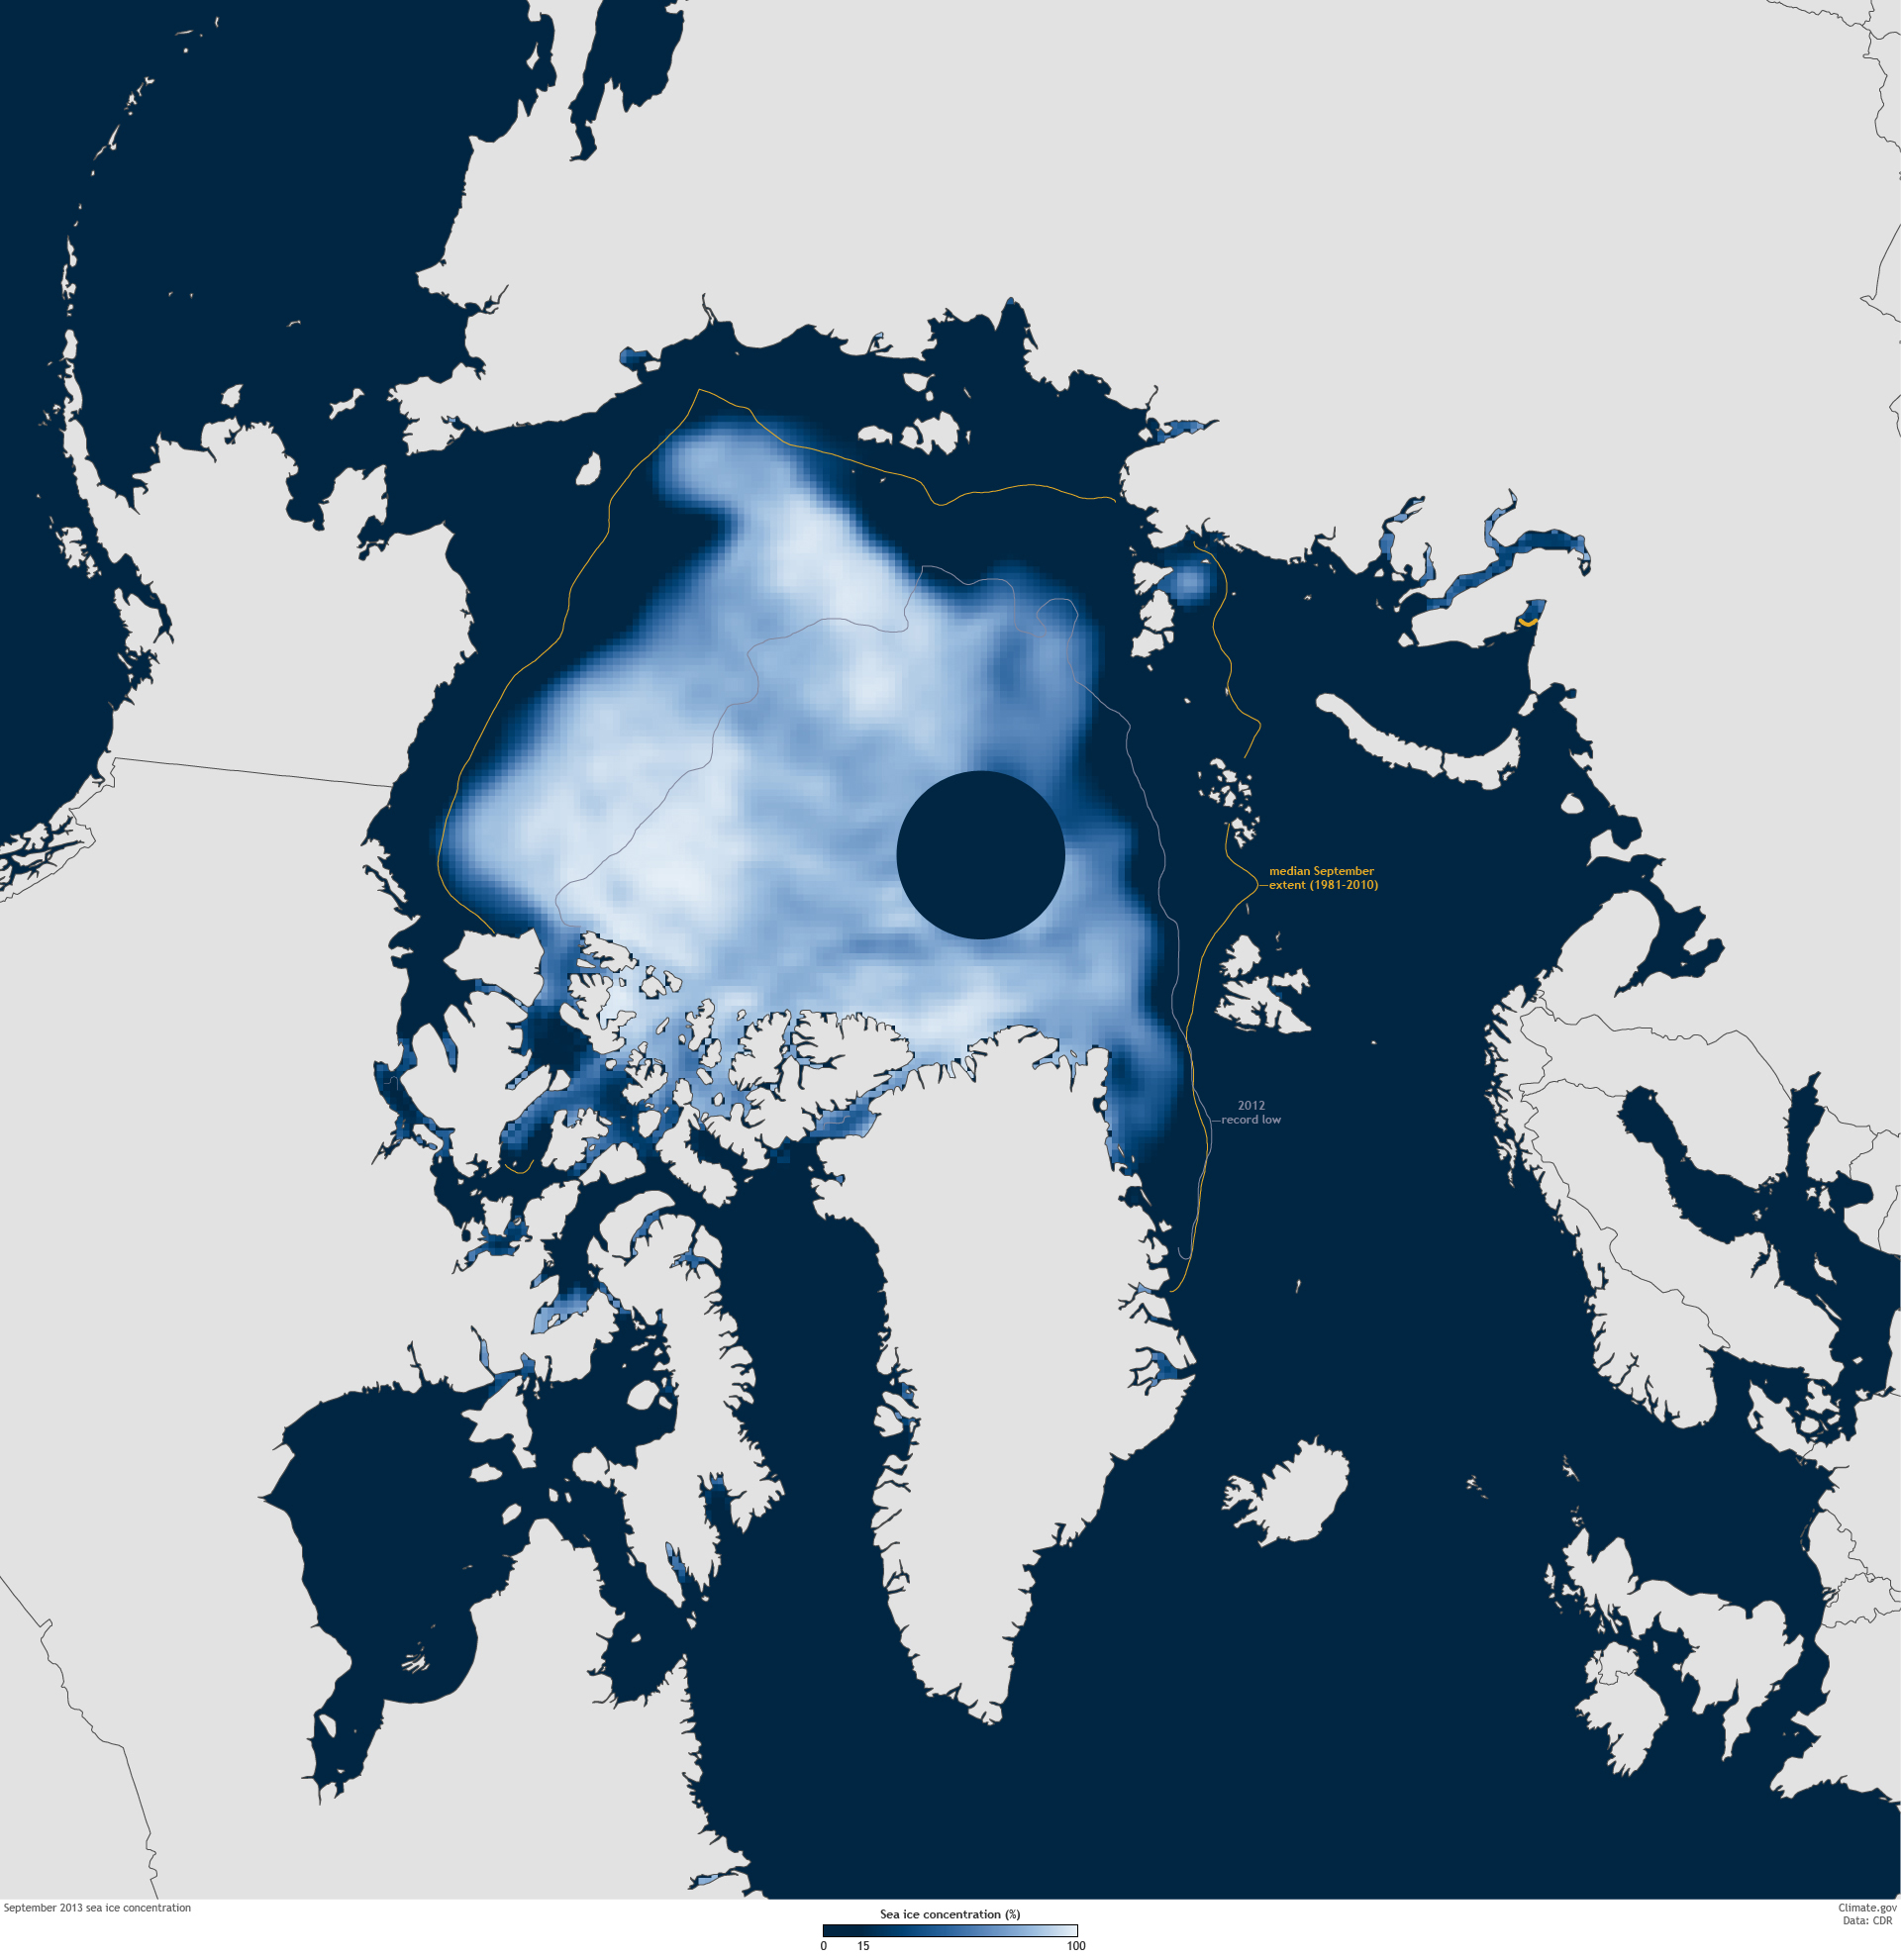
Sea ice concentration in September 2013 compared to the median extent from 1981-2010 (gold line) and the 2012 record low (gray line).
Map by NOAA Climate.gov, based on data provided by the National Snow and Ice Data Center. Adapted from Figure 5.12(b) in State of the Climate in 2013.
- The Arctic continued to warm; sea ice extent remained low:
The Arctic observed its seventh warmest year since records began in
the early 20th century. Record high temperatures were measured at
20-meter depth at permafrost stations in Alaska. Arctic sea ice extent
was the sixth lowest since satellite observations began in 1979. All
seven lowest sea ice extents on record have occurred in the past seven
years.
- Antarctic sea ice extent reached record high for second year in a row; South Pole station set record high temperature: The Antarctic maximum sea ice extent reached a record high of 7.56 million square miles on October 1. This is 0.7 percent higher than the previous record high extent of 7.51 million square miles that occurred in 2012 and 8.6 percent higher than the record low maximum sea ice extent of 6.96 million square miles that occurred in 1986. Near the end of the year, the South Pole had its highest annual temperature since records began in 1957.
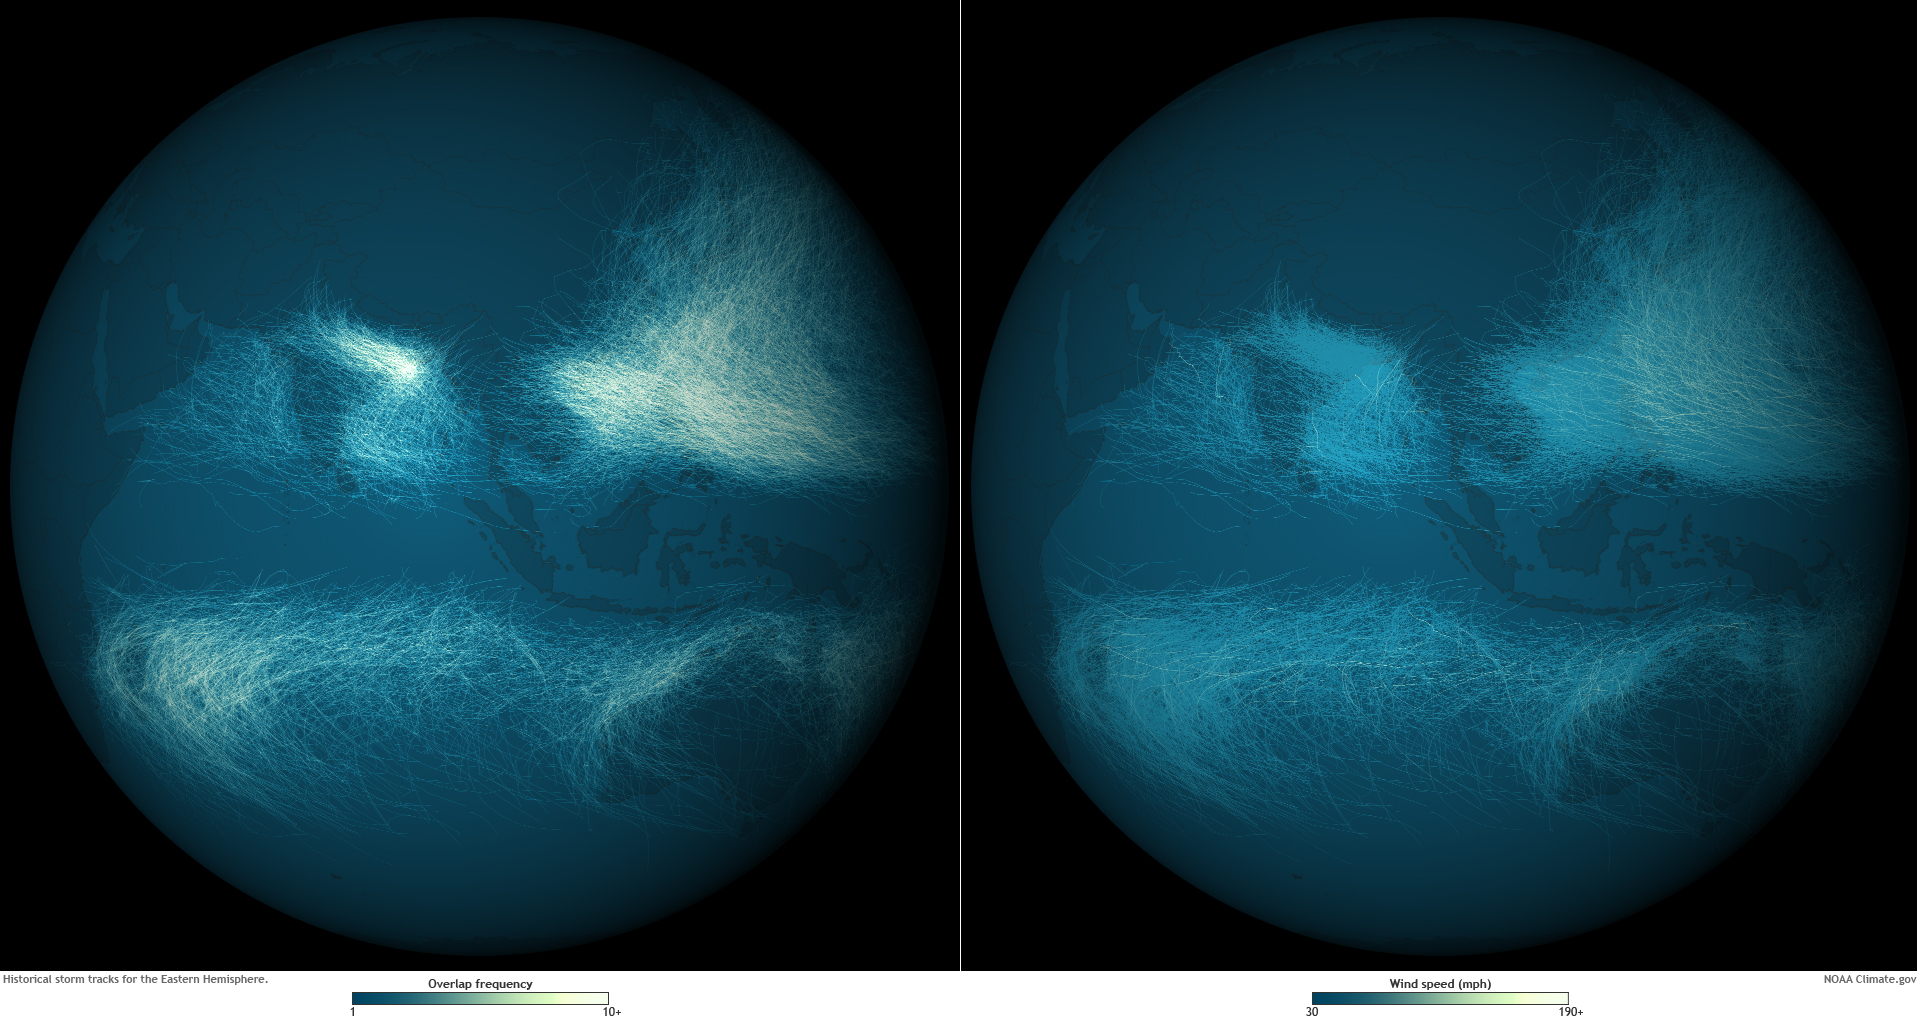
Tracks for the thousands of Eastern Hemisphere tropical cyclones documented in the International Best Track Archive for Climate Stewardship database for 1842-2012.
Rarely do storms form within ~5° of the equator.
Map by Dan Pisut, NOAA Environmental Visualization Lab.
- Tropical cyclones near average overall / Historic Super Typhoon: The number of tropical cyclones during 2013 was slightly above average, with a total of 94 storms, in comparison to the 1981-2010 average of 89. The North Atlantic Basin had its quietest season since 1994. However, in the Western North Pacific Basin, Super Typhoon Haiyan – the deadliest cyclone of 2013 – had the highest wind speed ever assigned to a tropical cyclone, with one-minute sustained winds estimated to be 196 miles per hour.
The journal makes the full report openly available online.
"State of the Climate is vital to documenting the world's climate," said Dr. Keith Seitter, AMS Executive Director. "AMS members in all parts of the world contribute to this NOAA-led effort to give the public a detailed scientific snapshot of what's happening in our world and builds on prior reports we've published."
NOAA’s mission is to understand and predict changes in the Earth's environment, from the depths of the ocean to the surface of the sun, and to conserve and manage our coastal and marine resources.
No comments:
Post a Comment