Tuesday, July 31, 2012

Arctic reconnaissance survey checks old soundings to prioritize future surveys

illustration was produced by John Whiddon, Coast Survey, Marine Chart Division
As indicated in this image, which displays the vintage of the U.S. Coast & Geodetic Survey (“geodetic” was added to the agency name in 1878) and NOAA soundings along the Fairweather reconnaissance path, vast swathes of lead line measurements were collected more than a hundred years ago.
Some of the small-scale charts in Alaskan waters use soundings from Captain Cook (1770s vintage) or even Vitus Bering (circa 1740).
While it is difficult to pinpoint exact sources, some soundings could also come from British Admiralty charts or Russian Empire charts.

From NOAA

NOAA’s Office of Coast Survey, Alaska, and the nation’s economic vitality have been intertwined for 145 years. We strengthen that bond on August 1, as NOAA Ship Fairweather begins a reconnaissance survey to the northernmost tip of the Alaska’s Arctic coast.
Fairweather will check soundings along a 1,500 nautical mile coastal corridor from Dutch Harbor, Alaska, to the Canadian border.
(At least, we hope Fairweather can go all the way to the Canadian border… The ice cover is a little stubborn this summer, and may not recede sufficiently for safe passage. CMDR Jim Crocker, the ship’s commanding officer and chief scientist of the party, will keep us updated through the coming weeks. Watch this blog site for Fairweather updates!)

Regardless of whether ice interferes with the final northern leg of the survey, the sounding samples acquired by Fairweather throughout the reconnaissance will provide critical information needed to prioritize NOAA’s future survey projects in the Arctic.

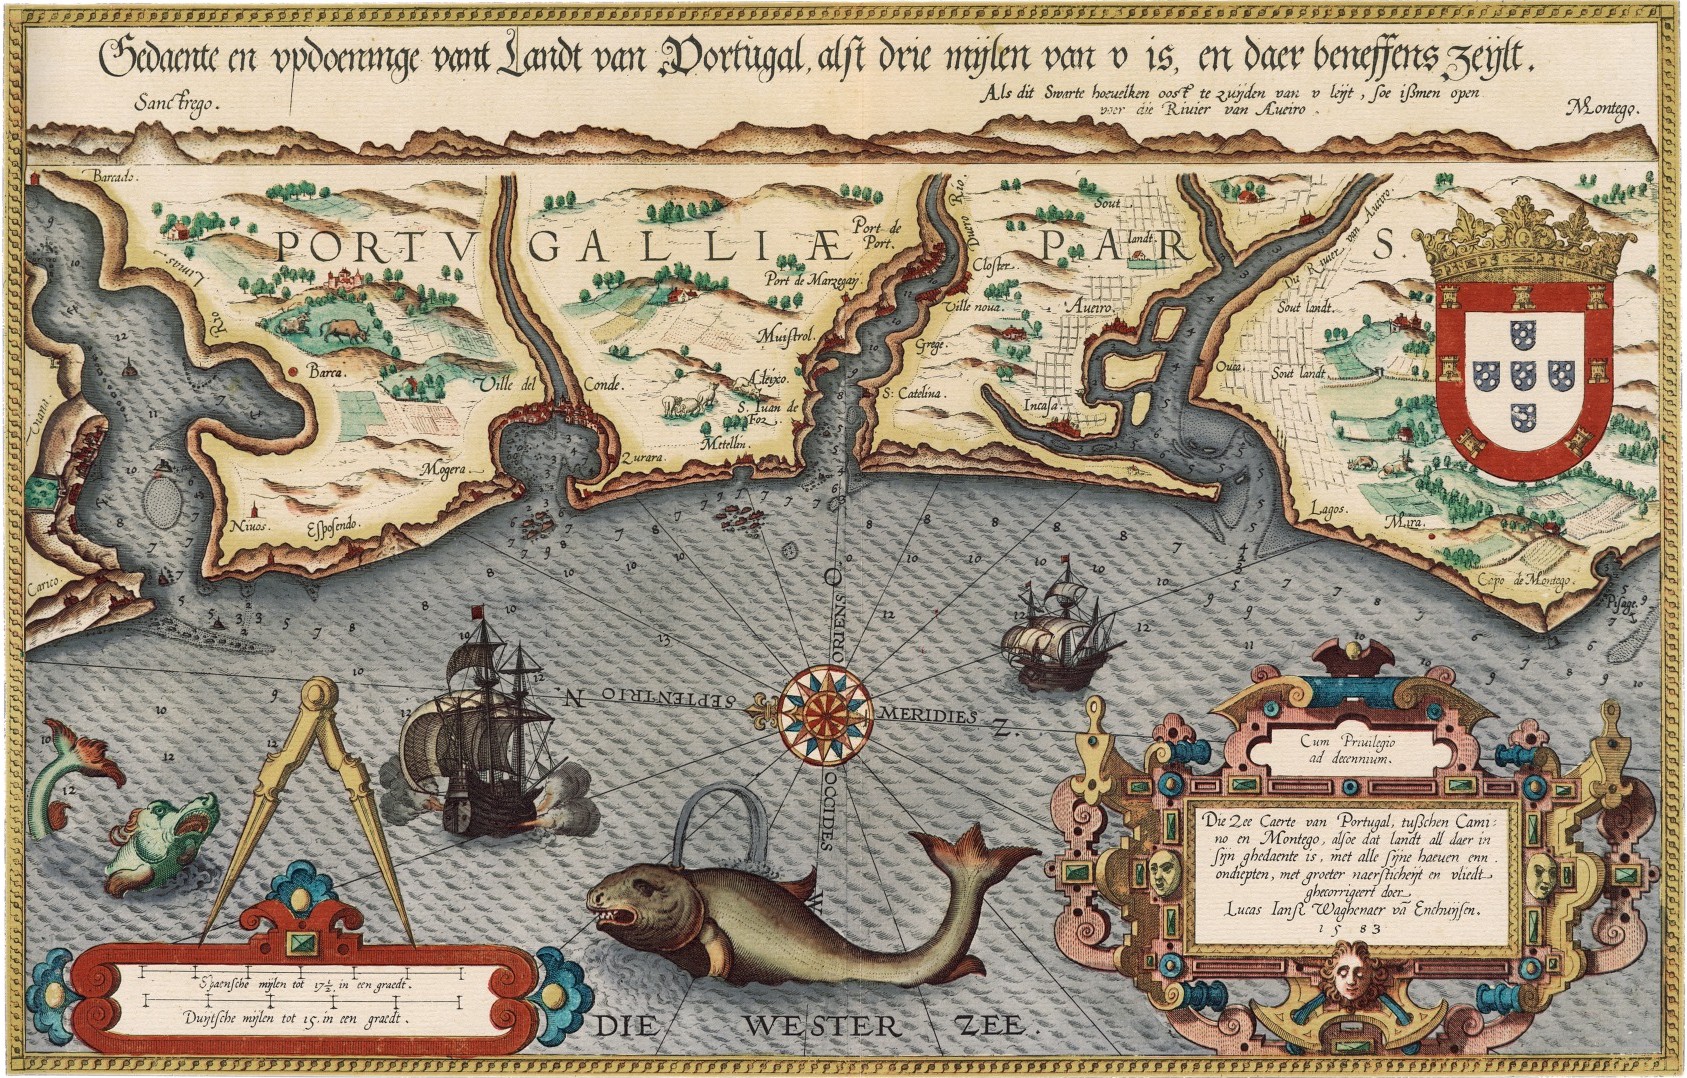
This 1898 General Chart of Alaska (partial image) was compiled from United States and Russian Authorities.

COAST SURVEY TIES TO ALASKA GO BACK 145 YEARS

The U.S. Coast Survey, one of NOAA’s predecessor organizations, was instrumental in the U.S. decision to purchase Alaska.
In 1867, Coast Surveyor George Davidson led the party making a geographical reconnaissance of Alaska, to assess the Russians’ offer to sell “Russian America” to the United States.
He assured U.S. officials that Alaska would bring valuable resources to the nation, and we purchased Alaska for $7.2 million.

Coast Survey started its post-Davidson Alaska work in 1871, when Assistant William H. Dall led survey teams that took soundings, triangulated Alaskan coasts, and made astronomical observations. Dall’s teams provided the information for the first U.S. nautical charts of Alaskan harbors and coves. (See this chart of Sanborn Harbor, 1872, for example.)
Coast Survey leadership, in their annual reports to Congress, foresaw that Alaska’s resource development would severely challenge the woefully inadequate transportation infrastructure at the time, and more hydrographic field parties were dispatched to Alaskan waters through the rest of the 19th century.

The NOAA Ship Fairweather is named after Mt. Fairweather, located in Alaska's Glacier Bay National Park and Preserve along the US-Canada border. Mt. Fairweather was named by Captain Cook in 1778, presumably because of the good weather encountered at the time of his visit.

FAIRWEATHER RECONNAISSANCE WILL HELP PRIORITIZE FUTURE SURVEYS

Fast forward to this century.
Modern ships navigating sea lanes in the Arctic should not be expected to trust ocean depth measurements reported by Captain Cook
A tanker, carrying millions of gallons of oil, should not be asked to rely on measurements made with lead lines, before modern technology allowed full bottom surveys.
Unfortunately, that’s exactly what navigators have to do, in too many cases.

Coast Survey has made it a priority to update the nautical charts needed by commercial shippers, passenger vessels, and fishing fleets transiting the Alaskan coastline in every greater numbers.
In June 2011, we issued the Arctic Nautical Charting Plan, a major effort to update Arctic nautical charts for the fairways, approaches, and ports along the Alaskan coast.
Before our cartographers can update the charts, however, they need up-to-date and accurate depth measurements. NOAA’s Office of Coast Survey is committed to getting that data.

Links :
  •  NOAA :Fairweather to Take Depth Measurements Along Busy Maritime Corridor

Scientists unlock ocean CO2 secrets key to climate: study

Clues to carbon storage in Southern Ocean

From RedOrbit

Using a fleet of robotic floats, a team of British and Australian scientists have uncovered the mechanism in the Southern Ocean that sequesters around 40 percent of the world’s carbon emissions.

A report on the team’s research, which was published this week in Nature Geoscience, showed that “mixed-layer depth, ocean currents, wind and eddies” create plunging currents that draw atmospheric carbon deep into the ocean, where it can remain for hundreds or thousands of years.

“The Southern Ocean is a large window by which the atmosphere connects to the interior of the ocean below,” said lead author Jean-Baptiste Sallée from British Antarctic Survey.

“Until now we didn’t know exactly the physical processes of how carbon ends up being stored deep in the ocean. It’s the combination of winds, currents and eddies that create these carbon-capturing pathways drawing waters down into the deep ocean from the ocean surface.”
“Now that we have an improved understanding of the mechanisms for carbon draw-down we are better placed to understand the effects of changing climate and future carbon absorption by the ocean,” he added.


Wandering albatross skims across the Southern Ocean.
The study examined how carbon is absorbed from the ocean's surface :
scientists now believe that, deep below, giant rivers are dragging down carbon dioxide from the surface in currents that could be up to 1000km wide.

Recent studies have also shown that naturally occurring currents in the Southern Ocean can draw carbon dioxide up from deep below the surface.

To study these plunging currents, which can measure 600 miles wide, the researchers launched 80 robotic floats back in 2002 and incrementally expanded the fleet to 3,000 by today.
The “Argo” floats are about a meter long and collect detailed temperature, pressure and salinity data. They can dive as deep as 2,000 meters into the ocean for 10 days at a time and are made to perform 150 such trips.

Based on data collected by the smart submersibles, the scientists found that the Southern Ocean absorbs carbon at specific spots where the confluence of factors is just right.
Previous theories stated that the ocean absorbed carbon uniformly across its surface.

According to study co-author Steve Rintoul of the Commonwealth Scientific and Industrial Research Organisation (CSIRO), these currents in the Southern Ocean are the most vital oceanic mechanism for eliminating greenhouse gases.

“There are other places in the ocean where the water sinks to the deep ocean, in particular—in the north Atlantic,” he said in an accompanying web video.
“But the Southern Ocean is the place with most active exchange between the interior of the ocean away from the surface and the surface layer of the ocean that’s in contact with the atmosphere—including with the carbon dioxide that we are pumping into the atmosphere.”

The scientists noted that the Southern Ocean plays an important role in reducing atmospheric carbon and warned that the factors that contribute to these carbon sequestering currents could be susceptible to climate change, increasing the possibility of a global warming feedback loop.

“If it wasn’t for the ocean acting as a sponge, climate would be changing more rapidly than it is today,” Rintoul said.
“Climate change will definitely interact with this process and modulate it,” co-author Richard Matear, of CSIRO, told Reuters.

Monday, July 30, 2012

Dynamic Earth


Watch as this NASA animation shows the sun blasting out a giant explosion of magnetic energy called a coronal mass ejection and the Earth being shielded from this by its powerful magnetic field.
The sun also continuously showers the Earth with light and radiation energy.
Much of this solar energy is deflected by the Earth's atmosphere or reflected back into space by clouds, ice and snow.
What gets through becomes the energy that drives the Earth system, powering a remarkable planetary engine -- the climate.

The unevenness of this solar heating, the cycles of day and night, and our seasons are part of what cause wind currents to circulate around the word.
These winds drive surface ocean currents and in this animation you can view these currents flowing off the coast of Florida.

This animation connects for the first time a series of computer models.
The view of the sun and the Earth's magnetic field comes from the Luhmann-Friesen magnetic field model and two models that incorporated data from a real coronal mass ejection from the sun on December 2006.

NASA's Community Coordinated Modeling Center (CCMC) at Goddard Space Flight Center, a multi-agency partnership that provides information on space weather to the international research community, generated these two models.
The ENLIL model is a time-dependent 3-D magnetohydrodynamic model of the heliosphere and shows changes in the particles flows and magnetic fields.
The BATS-R-US model is also a magnetohydrodynamic model of plasma from solar wind moving through the Earth's magnetic dipole field.
It uses measurements of solar wind density, velocity, temperature and magnetic field by NASA's Advanced Composition Explorer (ACE) satellite, which launched in August of 1997 and the Solar Terrestrial Relations Observatory (STEREO), two satellites that view the structure and evolution of solar storms.

The view of the Earth's atmosphere comes from the Modern-Era Retrospective Analysis for Research and Applications (MERRA), a computer model that uses data from the Goddard Earth Observing System Data Assimilation System Version 5 (GEOS-5) and incorporates information gathered from ground stations, operational satellites and NASA's Earth-observing fleet of satellites.
The model for the ocean is the Estimating the Circulation and Climate of the Ocean, Phase II (ECCO2), a joint project of the Massachusetts Institute of Technology in Cambridge, Mass. and NASA's Jet Propulsion Laboratory in Pasadena, Ca.

This video is public domain and can be downloaded at: http://svs.gsfc.nasa.gov/goto?11003

Sunday, July 29, 2012

Book review : The Sea Chart

The Sea Chart: The Illustrated History of Nautical Maps and Navigational Charts

Splendidly evocative of Britain's sea inheritance, with details trawled from a thousand years of colourful nautical history, this is a book to open the eyes.
Using the device of a circumnavigation, Blake shows how a mariner's perception of these shores has varied over the centuries, and includes fascinating detail of the charts and instruments that have contributed.

This wonderfully illustrated book features rare and detailed charts from the ages which will handsomely repay the armchair sailor poring over it with a magnifier.

This book examines the history of the sea chart in both aesthetic and scientific terms.
Chapters are organized along chronological and geographical lines.

 Robert Dudley: Dell’Arcano del Mare (1646-1647)

Each one opens with a succinct history of the charting of a particular area, and is followed by a sumptuous plate section of significant charts that support the text.
Stand alone feature boxes explain key figures and themes.

 Sea map of Portugal (from: Mariner’s Mirror 1584)

"What makes this book so impressive is the selection of charts that the author, John Blake, has carefully gathered together from some of the most important archives in the world.
The collection includes the early portolan charts of the fifteenth century, original manuscript charts of Europe, India and the Orient, and nautical maps that show the medieval view of the known world."

A chart of the Gulf Stream by James Poupard, sculp.
Appeared in the Transactions of the American Philosophical Society, 1786.
Includes inset of North Atlantic and text in left margin "Remarks upon the navigation from Newfoundland to New-York, in order to avoid the Gulph Stream on one hand, and on the other the shoals that lie to the southward of Nantucket and of St. George's Banks," by Benjamin Franklin.

This volume features examples from famous sets of charts, such as The Mariner's Mirrour, the English translation of the celebrated Spieghel der Zeevaerdt, Dell' Arcano del Mare, Le Neptune Francois, and the Atlantic Neptune, together with rare examples of individual charts, such as Benjamin Franklin's Chart of the North Atlantic.

 Le Neptune françois, the first nautical atlas published in France (BNF)

Saturday, July 28, 2012

Multihull hydrofoil and wakeboarding

 Laird, aboard the Hydroptere, with a team of guys attempting to break another type of record,
gets behind the fastest sail boat in the world and breaks the speed record for hydrofoil boarding.
(see article


SAP Extreme Sailing Team find a new use for their Extreme 40 between Acts


Trimaran wakeboarding

Friday, July 27, 2012

US NOAA update in the Marine GeoGarage


39 charts have been updated in the Marine GeoGarage
(NOAA update May/June 2012)
 

  • 11350 WAX LAKE OUTLET TO FORKED ISLAND
  • 11356 ISLES DERNIERES TO POINT AU FER
  • 11369 LAKES PONTCHARTRAIN AND MAUREPAS
  • 11388 CHOCTAWHATCHEE BAY
  • 11491 ST JOHNS RVR - ATLANTIC OCEAN TO JACKSONVILLE FL
  • 12216 CAPE HENLOPEN TO INDIAN RIVER INLET
  • 12263 CHEASAPEAKE BAY COVE POINT TO SANDY POINT
  • 12282 CHESAPEAKE BAY SEVERN AND MAGOTHY RIVERS
  • 12300 NY APPROACHES - NANTUCKET SHOALS TO FIVE FATHOM BANK
  • 12314 DELAWARE RIVER-PHILADELPHIA TO TRENTON-MAIN PANEL
  • 12370 N SHR LONG I SND-HOUSATONIC R AND MILFORD HBR
  • 12402 NEW YORK LOWER BAY NORTHERN PART
  • 13241 NANTUCKET ISLAND MA
  • 13305 PENOBSCOT BAY ME
  • 13322 WINTER HARBOR ME
  • 18525 COLUMBIA RIVER SAINT HELENS TO VANCOUVER
  • 18526 PORT OF PORTLAND INCLUDING VANCOUVER
  • 18527 SWAN ISLAND BASIN WILLAMETTE RIVER
  • 18531 COLUMBIA RIVER VANCOUVER TO BONNEVILLE
  • 18556 NEHALEM RIVER
  • 25644 FREDERIKSTED ROAD
  • 1116A LEASE BLOCK FOR MISSISSIPPI RIVER TO GALVESTON
  • 11322 DRUM BAY TO GALVESTON BAY
  • 11340 MISSISSIPPI RIVER TO GALVESTON
  • 11346 PORT FOURCHON AND APPROACHES
  • 11357 TIMBALIER AND TERREBONNE BAYS
  • 11445 BAHIA HONDA KEY TO SUGARLOAF KEY
  • 11518 ICW CASINO CREEK TO BEAUFORT RIVER
  • 12205 CAPE HENRY-PAMLICO SND INCL ALBEMARLE SND VA-NC
  • 12281 BALTIMORE HARBOR
  • 12283 ANNAPOLIS HARBOR
  • 12311 DELAWARE RIVER SMYRNA RIVER TO WILMINGTON
  • 12312 DELAWARE RIVER WILMINGTON TO PHILADELPHIA
  • 12354 LONG ISLAND SOUND-EASTERN PART CONN-NY
  • 13315 DEER ISLAND THOROFARE AND CASCO PASSAGE
  • 16662 COOK INLET KALGIN ISLAND TO NORTH FORELAND
  • 18754 NEWPORT BAY
  • 18763 SAN CLEMENTE ISLAND NORTHERN PART
  • 18773 SAN DIEGO BAY
Today 1021 NOAA raster charts (2166 including sub-charts) are included in the Marine GeoGarage viewer.

Note : NOAA updates their nautical charts with corrections published in:
  • U.S. Coast Guard Local Notices to Mariners (LNMs),
  • National Geospatial-Intelligence Agency Notices to Mariners (NMs), and
  • Canadian Coast Guard Notices to Mariners (CNMs)
While information provided by this Web site is intended to provide updated nautical charts, it must not be used as a substitute for the United States Coast Guard, National Geospatial-Intelligence Agency, or Canadian Coast Guard Notice to Mariner publications

Please visit the
NOAA's chart update service for more info.

Canada CHS update in the Marine GeoGarage


50 charts have been updated (June 29, 2012) :

    • 1220    BAIE DES SEPT ILES
    • 1226    ANCHORAGES AND HARBOURS INSTALLATIONS / HAUTE COTE-NORD
    • 1234    CAP DE LA TETE AU CHIEN TO CAP AUX OIES
    • 1312    LAC SAINT-PIERRE
    • 1313    BATISCAN TO LAC SAINT-PIERRE
    • 1314    DONNACONA TO BATISCAN
    • 1350A    SOREL - TRACY TO RUISSEAU LAHAISE
    • 1350B    RUISSEAU LAHAISE TO SAINT-ANTOINE-SUR-RICHELIEU
    • 1350C    SAINT-ANTOINE-SUR-RICHELIEU TO ILE AUX CERFS
    • 1350D    ILE AUX CERFS TO OTTERBURN PARK
    • 3424    APPROACHES TO OAK BAY
    • 3440    RACE ROCKS TO D'ARCY ISLAND
    • 3461    JUAN DE FUCA STRAIT EASTERN PORTION
    • 3462    JUAN DE FUCA STRAIT TO STRAIT OF GEORGIA
    • 3479    APPROACHES TO SIDNEY
    • 3481    APPORACHES TO VANCOUVER HARBOUR
    • 3493    VANCOUVER HARBOUR WESTERN PORTION
    • 3526    HOWE SOUND
    • 3800    DIXON ENTRANCE
    • 4001    GULF OF MAINE TO STRAIT OF BELLE ISLE
    • 4003    CAPE BRETON TO CAPE COD
    • 4011    APPROACHES TO BAY OF FUNDY
    • 4013    HALIFAX TO SYDNEY
    • 4045    SABLE ISLAND BANK TO ST. PIERRE BANK
    • 4098    SABLE ISLAND
    • 4114    CAMPOBELLO ISLAND
    • 4209    LOCKEPORT HARBOUR AND SHELBURNE HARBOUR
    • 4233    CAPE CANSO TO COUNTRY ISLAND
    • 4234    COUNTRY ISLAND TO BARREN ISLAND
    • 4281    CANSO HARBOUR AND APPROACHES
    • 4307    CANSO HARBOUR TO STRAIT OF CANSO
    • 4308    ST. PETERS BAY TO STRAIT OF CANSO
    • 4335    STRAIT OF CANSO AND APPROACHES
    • 4379    LIVERPOOL HARBOUR
    • 4403    EAST POINT TO CAPE BEAR
    • 4404    CAPE GEORGE TO PICTOU
    • 4420    MURRAY HARBOUR
    • 4428    HAVRE DE NATASHQUAN AND APROACHES
    • 4459    SUMMERSIDE HARBOUR AND APPROACHES
    • 4486    BAIE DES CHALEURS
    • 4514    ST. ANTHONY BIGHT
    • 4522    TILT COVE AND LA SCIE HARBOUR (APPROACHES TO LA SCIE HARBOUR)
    • 4530    HAMILTON SOUND EASTERN PORTION
    • 4619    PRESQUE HARBOUR TO BAR HAVEN ISLAND AND PARADISE SOUND
    • 4639    GARIA BAY AND LE MOINE BAY
    • 4663    COW HEAD TO POINTE RICHE
    • 4830    GREAT BAY DE L'EAU AND APPROACHES
    • 4832    FORTUNE BAY - SOUTHERN PORTION
    • 4839    HEAD OF PLACENTIA BAY
    • 4855    BONAVISTA BAY SOUTHERN PORTION
    • 4906    WEST POINT TO BAIE DE TRACADIE
    • 4909    BUCTOUCHE HARBOUR
    • 4913    CARAQUET HARBOUR  BAIE DE SHIPPEGAN AND MISCOU HARBOUR
    So 688 charts (1659 including sub-charts) are available in the Canada CHS layer. (see coverage)

    Note : don't forget to visit 'Notices to Mariners' published monthly and available from the Canadian Coast Guard both online or through a free hardcopy subscription service.
    This essential publication provides the latest information on changes to the aids to navigation system, as well as updates from CHS regarding CHS charts and publications.
    See also written Notices to Shipping and Navarea warnings : NOTSHIP

    DHN Brazil update in the Marine GeoGarage


    1 chart has been added and 27 have been updated 
    (DHN update June 21/July 11, 2012)

      • 200     DA ILHA DE MARACÁ À ILHA DO MACHADINHO
      • 231     DA ILHA DO MACHADINHO AO CABO MAGUARI (PROXIMIDADES DA BARRA SUL DO AMAZONAS)
      • 412     BAÍA DE SÃO MARCOS PROXIMIDADES DO TERMINAL DA PONTA DA MADEIRA E ITAQUI
      • 802     PORTO DE NATAL
      • 810     PROXIMIDADES DO PORTO DE NATAL
      • 910     PROXIMIDADES ITAPESSOCA
      • 930     PROXIMIDADES DO PORTO DO RECIFE
      • 1402     DO PONTAL DA REGÊNCIA À PONTA DO UBU
      • 1410     PROXIMIDADES DOS PORTOS DE VITORIA E TUBARÃO
      • 1505     DO CABO BÚZIOS AO CABO FRIO
      • 1506     PROXIMIDADE DA BAÍA DE GUANABARA
      • 1511     BARRA DO RIO DE JANEIRO
      • 1513     TERMINAIS DA BAÍA DE GUANABARA
      • 1515     BAÍA DE GUANABARA - ILHA DO MOCANGUÊ E PROXIMIDADES
      • 1531     ILHA DO BOQUEIRÃO E ADJACÊNCIA
      • 1550     BACIA DE CAMPOS
      • 1635     DA ILHA DAS COUVES A ILHA DO MAR VIRADO
      • 1643     CANAL DE SÃO SEBASTIÃO (PARTE NORTE)
      • 1644     CANAL DE SÃO SEBASTIÃO (PARTE SUL)
      • 1645     CANAL DE SÃO SEBASTIÃO
      • 1804     PORTO DE SÃO FRANCISCO DO SUL
      • 22200     DE CABEDELO A MACEIÓ
      • 23100     DO RIO DE JANEIRO À SANTOS
      • 241     DA BAÍA DO VIEIRA GRANDE A CHAVES (BRAÇO SUL DO RIO AMAZONAS)
      • 304     DE MOSQUEIRO À ABAETETUBA
      • 1701     PORTO DE SANTOS
      • 1904     CANAL SUL DE SANTA CATARINA
      • 21020     DE SALINÓPOLIS A FORTALEZA

      Today 321 charts (369 including sub-charts) from DHN are displayed in the Marine GeoGarage

      UK & misc. update in the Marine GeoGarage

      Today 970 charts (1822 including sub-charts) are available in the 'UK & misc.' chart layer
      regrouping charts for different countries :
      1. UK
      2. Argentina
      3. Belgium
      4. Netherlands
      5. Croatia
      6. Oman
      7. Portugal
      8. Spain
      9. Iceland
      10. South Africa
      11. Malta

      644 charts for UK

      24 charts for Argentina :

      • 226    International Chart Series, Antarctica - South Shetlands Islands, Deception Island.
      • 227    Church Point to Cape Longing including James Ross Island
      • 531    Plans on the Coast of Argentina     NEW
      • 552    Plans on the Coast of Argentina     NEW
      • 557    Mar del Plata to Comodoro Rivadavia     NEW
      • 1302    Cabo Guardian to Punta Nava     NEW
      • 1331    Argentina, Approaches to Bahia Blanca     NEW
      • 1332    Isla de los Estados and Estrecho de le Maire     NEW
      • 1751    Puerto de Buenos Aires     NEW
      • 1982B    Rio Parana - Rosario to Parana     NEW
      • 2505    Approaches to the Falkland Islands
      • 2517    North-Western Approaches to the Falkland Islands
      • 2519    South-Western Approaches to the Falkland Islands
      • 3065    Punta Piedras to Quequen     NEW
      • 3066    Quequen to Rio Negro     NEW
      • 3067    Rio Negro to Isla Leones     NEW
      • 3106    Isla Leones to Pto San Julian     NEW
      • 3213    Plans in Graham Land
      • 3560    Gerlache Strait  Northern Part
      • 3566    Gerlache Strait  Southern Part
      • 3755    Bahia Blanca     NEW
      • 4063    Bellingshausen Sea to Valdivia     NEW
      • 4200    Rio de la Plata to Cabo de Hornos     NEW
      • 4207    Falkland Islands to Cabo Corrientes and Northeast Georgia Rise
      27 charts for Belgium & Nederlands :

      • 99 Entrances to Rivers in Guyana and Suriname
      • 110 Westkapelle to Stellendam and Maasvlakte
      • 112 Terschellinger Gronden to Harlingen
      • 120 Westerschelde - Vlissingen to Baalhoek and Gent - Terneuzen Canal
      • 122 Approaches to Europoort and Hoek van Holland
      • 124 Noordzeekanaal including Ijmuiden, Zaandam and Amsterdam
      • 125 North Sea Netherlands - Approaches to Scheveningen and Ijmuiden
      • 126 North Sea, Netherlands, Approaches to Den Helder
      • 128 Westerschelde, Valkenisse to Wintam
      • 207 Hoek Van Holland to Vlaardingen
      • 208 Rotterdam, Nieuwe Maas and Oude Maas
      • 209 Krimpen a/d Lek to Moerdijk
      • 266 North Sea Offshore Charts Sheet 11
      • 572 Essequibo River to Corentyn River
      • 702 Nederlandse Antillen, Aruba and Curacao
      • 1187 Outer Silver Pit
      • 1408 North Sea, Harwich and Rotterdam to Cromer and Terschelling.
      • 1412 Caribbean Sea - Nederlandse Antillen, Ports in Aruba and Curacao
      • 1414 Bonaire
      • 1503 Outer Dowsing to Smiths Knoll including Indefatigable Banks.
      • 1504 Cromer to Orford Ness
      • 1546 Zeegat van Texel and Den Helder Roads
      • 1630 West Hinder and Outer Gabbard to Vlissingen and Scheveningen
      • 1631 DW Routes to Ijmuiden and Texel
      • 1632 DW Routes and Friesland Junction to Vlieland
      • 1874 North Sea, Westerschelde, Oostende to Westkapelle
      • 2047 Approaches to Anguilla

      14 charts for Croatia :

      • 201 Rt Kamenjak to Novigrad
      • 202 Kvarner, Kvarneric and Velebitski Kanal
      • 269 Ploce and Split with Adjacent Harbours, Channels and Anchorages
      • 515 Zadar to Luka Mali Losinj
      • 683 Bar, Dubrovnik and Approaches and Peljeski Kanal
      • 1574 Otok Glavat to Ploce and Makarska
      • 1580 Otocic Veliki Skolj to Otocic Glavat
      • 1582 Approaches to Bar and Boka Kotorska
      • 1996 Ports in Rijecki Zaljev
      • 2711 Rogoznica to Zadar
      • 2712 Otok Susac to Split
      • 2719 Rt Marlera to Senj including Approaches to Rijeka
      • 2773 Sibenik, Pasmanski Kanal, Luka Telascica, Sedmovrace, Rijeka Krka
      • 2774 Otok Vis to Sibenik
       6 charts for Oman :

      • 2851 Masirah to the Strait of Hormuz
      • 2854 Northern approaches to Masirah
      • 3171 Southern Approaches to the Strait of Hormuz
      • 3409 Plans in Iran, Oman and the United Arab Emirates
      • 3511 Wudam and Approaches
      • 3518 Ports and Anchorages on the North East Coast of Oman


      124 charts for Spain & Portugal :

      • 73 Puerto de Huelva and Approaches
      • 83 Ports on the South Coast of Portugal
      • 85 Spain - south west coast, Rio Guadalquivir
      • 86 Bahia de Cadiz
      • 87 Cabo Finisterre to the Strait of Gibraltar
      • 88 Cadiz
      • 89 Cabo de Sao Vicente to Faro
      • 91 Cabo de Sao Vicente to the Strait of Gibraltar
      • 93 Cabo de Santa Maria to Cabo Trafalgar
      • 142 Strait of Gibraltar
      • 144 Mediterranean Sea, Gibraltar
      • 307 Angola, Cabeca da Cobra to Cabo Ledo
      • 308 Angola, Cabo Ledo to Lobito
      • 309 Lobito to Ponta Grossa
      • 312 Luanda to Baia dos Tigres
      • 366 Arquipelago de Cabo Verde
      • 369 Plans in the Arquipelago de Cabo Verde
      • 469 Alicante
      • 473 Approaches to Alicante
      • 518 Spain East Coast, Approaches to Valencia
      • 562 Mediterranean Sea, Spain - East Coast Valencia
      • 580 Al Hoceima, Melilla and Port Nador with Approaches
      • 659 Angola, Port of Soyo and Approache
      • 690 Cabo Delgado to Mikindani Bay
      • 886 Estrecho de la Bocayna and Approaches to Arrecife
      • 1094 Rias de Ferrol, Ares, Betanzos and La Coruna
      • 1096 Ribadeo
      • 1110 La Coruna and Approaches
      • 1111 Punta de la Estaca de Bares to Cabo Finisterre
      • 1113 Harbours on the North-West Coast of Spain
      • 1117 Puerto de Ferrol
      • 1118 Ria de Ferrol
      • 1122 Ports on the North Coast of Spain
      • 1133 Ports on the Western Part of the North Coast of Spain
      • 1142 Ria de Aviles
      • 1145 Spain - North Coast, Santander
      • 1150 Ports on the North Coast of Spain
      • 1153 Approaches to Gijon
      • 1154 Spain, north coast, Gijon
      • 1157 Pasaia (Pasajes) and Approaches
      • 1172 Puertos de Bermeo and Mundaka
      • 1173 Spain - North Coast, Bilbao
      • 1174 Approaches to Bilbao
      • 1180 Barcelona
      • 1189 Approaches to Cartagena
      • 1193 Spain - east coast, Tarragona
      • 1194 Cartagena
      • 1196 Approaches to Barcelona
      • 1197 Plans on the West Coast of Africa
      • 1215 Plans on the Coast of Angola
      • 1216 Baia dos Tigres
      • 1290 Cabo de San Lorenzo to Cabo Ortegal
      • 1291 Santona to Gijon
      • 1448 Gibraltar Bay
      • 1453 Gandia
      • 1455 Algeciras
      • 1460 Sagunto
      • 1514 Spain - East Coast, Castellon
      • 1515 Ports on the East Coast of Spain
      • 1589 Almeria
      • 1595 Ilhas do Principe, de Sao Tome and Isla Pagalu
      • 1684 Ilha da Madeira, Manchico and Canical
      • 1685 Nisis Venetico to Nisos Spetsai including the Channels between Akra Maleas and Kriti
      • 1689 Ports in the Arquipelago da Madeira
      • 1701 Cabo de San Antonio to Vilanova I la Geltru including Islas de Ibiza and Formentera
      • 1703 Mallorca and Menorca
      • 1704 Punta de la Bana to Islas Medas
      • 1724 Canal do Geba and Bissau
      • 1726 Approaches to Canal do Geba and Rio Cacheu
      • 1727 Bolama and Approaches
      • 1730 Spain - West Coast, Ria de Vigo
      • 1731 Vigo
      • 1732 Spain - West Coast, Ria de Pontevedra
      • 1733 Spain - West Coast, Marin and Pontevedra
      • 1734 Approaches to Ria de Arousa
      • 1740 Livingston Island, Bond Point to Brunow Bay including Juan Carlos 1 Base and Half Moon Island
      • 1755 Plans in Ria de Arousa
      • 1756 Ria de Muros
      • 1762 Vilagarcia de Arosa
      • 1764 Ria de Arousa
      • 1831 Arquipelago da Madeira
      • 1847 Santa Cruz de Tenerife
      • 1850 Approaches to Malaga
      • 1851 Malaga
      • 1854 Motril and Adra
      • 1856 Approaches to Puerto de La Luz (Las Palmas)
      • 1858 Approaches to Santa Cruz de Tenerife, Puerto de San Sebastian de la Gomera, Santa Cruz de la Palma and Approaches
      • 1869 Gran Canaria to Hierro
      • 1870 Lanzarote to Gran Canaria
      • 1895 Ilha de Sao Miguel
      • 1950 Arquipelago dos Acores
      • 1956 Arquipelago dos Acores Central Group
      • 1957 Harbours in the Arquipelago Dos Acores (Central Group)
      • 1959 Flores,Corvo and Santa Maria with Banco Das Formigas
      • 2742 Cueta
      • 2761 Menorca
      • 2762 Menorca, Mahon
      • 2831 Punta Salinas to Cabo de Formentor including Canal de Menorca
      • 2832 Punta Salinas to Punta Beca including Isla de Cabrera
      • 2834 Ibiza and Formentera
      • 2932 Cabo de Sao Sebastiao to Beira
      • 2934 Africa - east coast, Mozambique, Beira to Rio Zambeze
      • 2935 Quelimane to Ilha Epidendron
      • 3034 Approaches to Palma
      • 3035 Palma
      • 3220 Entrance to Rio Tejo including Baia de Cascais
      • 3221 Lisboa, Paco de Arcos to Terreiro do Trigo
      • 3222 Lisboa, Alcantara to Canal do Montijo
      • 3224 Approaches to Sines
      • 3227 Aveiro and Approaches
      • 3228 Approaches to Figueira da Foz
      • 3257 Viana do Castelo and Approaches
      • 3258 Approaches to Leixoes and Barra do Rio Douro
      • 3259 Approaches to Setubal
      • 3260 Carraca to Ilha do Cavalo
      • 3448 Plans in Angola
      • 3578 Eastern Approaches to the Strait of Gibraltar
      • 3633 Islas Sisargas to Montedor
      • 3634 Montedor to Cabo Mondego
      • 3635 Cabo Mondego to Cabo Espichel
      • 3636 Cabo Espichel to Cabo de Sao Vicente
      • 3764 Cabo Torinana to Punta Carreiro
      • 4114 Arquipelago dos Acores to Flemish Cap
      • 4115 Arquipelago dos Acores to the Arquipelago de Cabo Verde
      • Ilha de Madeira, Ponta Gorda de Sao Lourenco including the Port of Funchal


      14 charts for Iceland :

      • 2733 Dyrholaey to Snaefellsjokull
      • 2734 Approaches to Reykjavik
      • 2735 Iceland - South West Coast, Reykjavik
      • 2897 Iceland
      • 2898 Vestfirdir
      • 2899 Iceland, Noth Coast, Horn to Rauoinupur
      • 2900 Iceland, North East Coast, Rauoinupur to Glettinganes
      • 2901 Iceland, East Coast, Glettinganes to Stokksnes
      • 2902 Stokksnes to Dyrholaey
      • 2955 Iceland, North Coast, Akureyri
      • 2956 Iceland, North Coast, Eyjafjordur
      • 2937 Hlada to Glettinganes
      • 2938 Reydarfjordur
      • 4112 North Atlantic Ocean, Iceland to Greenland   NEW


      47 charts for South Africa :

      • 578 Cape Columbine to Cape Seal
      • 632 Hollandsbird Island to Cape Columbine
      • 643 Durban Harbour
      • 1236 Saldanha Bay
      • 1769 Islands and Anchorages in the South Atlantic Ocean
      • 1806 Baia dos Tigres to Conception Bay
      • 1846 Table Bay Docks and Approaches
      • 1922 RSA - Simon's Bay
      • 2078 Port Nolloth to Island Point
      • 2086 East London to Port S Johns
      • 2087 Port St John's to Durban
      • 2088 Durban to Cape Vidal
      • 2095 Cape St Blaize to Port S. John's
      • 3793 Shixini Point to Port S Johns
      • 3794 Port S Johns to Port Shepstone
      • 3795 Port Shepstone to Cooper Light
      • 3797 Green Point to Tongaat Bluff
      • 3859 Cape Cross to Conception Bay
      • 3860 Mutzel Bay to Spencer Bay
      • 3861 Namibia, Approaches to Luderitz
      • 3869 Hottentot Point to Chamais Bay
      • 3870 Chamais Bay to Port Nolloth
      • 4132 Kunene River to Sand Table Hill
      • 4133 Sand Table Hill to Cape Cross
      • 4136 Harbours on the West Coasts of Namibia and South Africa
      • 4141 Island Point to Cape Deseada
      • 4142 Saldanha Bay Harbour
      • 4145 Approaches to Saldanha Bay
      • 4146 Cape Columbine to Table Bay
      • 4148 Approaches to Table Bay
      • 4150 Republic of South Africa, South West Coast, Table Bay to Valsbaai
      • 4151 Cape Deseada to Table Bay
      • 4152 Republic of South Africa, South West Coast, Table Bay to Cape Agulhas
      • 4153 Republic of South Africa, South Coast, Cape Agulhas to Cape St. Blaize
      • 4154 Mossel Bay
      • 4155 Cape St Blaize to Cape St Francis
      • 4156 South Africa, Cape St Francis to Great Fish Point
      • 4157 South Africa, Approaches to Port Elizabeth
      • 4158 Republic of South Africa - South Coast, Plans in Algoa Bay.
      • 4159 Great Fish Point to Mbashe Point
      • 4160 Ngqura Harbour
      • 4162 Approaches to East London
      • 4170 Approaches to Durban
      • 4172 Tugela River to Ponta do Ouro
      • 4173 Approaches to Richards Bay
      • 4174 Richards Bay Harbour
      • 4205 Agulhas Plateau to Discovery Seamounts


        5 charts for Malta :

        • 36 Marsaxlokk
        • 177 Valletta Harbours
        • 211 Plans in the Maltese Islands
        • 2537 Ghawdex (Gozo), Kemmuna (Comino) and the Northern Part of Malta
        • 2538 Malta

        65 international charts from NGA


        • 3 Chagos Archipelago
        • 82 Outer Approaches to Port Sudan
        • 100 Raas Caseyr to Suqutra
        • 255 Eastern Approaches to Jamaica
        • 256 Western Approaches to Jamaica
        • 260 Pedro Bank to the South Coast of Jamaica
        • 333 Offshore Installations in the Gulf of Suez
        • 334 North Atlantic Ocean, Bermuda
        • 386 Yadua Island to Yaqaga Island
        • 390 Bahamas, Grand Bahama Island, Approaches to Freeport
        • 398 Grand Bahama Island, Freeport Roads, Freeport Harbour
        • 457 Portland Bight
        • 462 The Cayman Islands
        • 486 Jamaica and the Pedro Bank
        • 501 South East Approaches to Trinidad
        • 666 Port Mombasa including Port Kilindini and Port Reitz
        • 700 Maiana to Marakei
        • 766 Ellice Islands
        • 868 Eastern and Western Approaches to The Narrows including Murray's Anchorage
        • 920 Chagos Archipelago, Diego Garcia
        • 928 Sulu Archipelago
        • 959 Colson Point to Belize City including Lighthouse Reef and Turneffe Islands
        • 1043 Saint Lucia to Grenada and Barbados
        • 1225 Gulf of Campeche
        • 1265 Approaches to Shatt Al 'Arab or Arvand Rud, Khawr Al Amaya and Khawr Al Kafka
        • 1450 Turks and Caicos Islands, Turks Island Passage and Mouchoir Passage
        • 1638 Plans in Northern Vanuatu
        • 2006 West Indies, Virgin Islands, Anegada to Saint Thomas
        • 2009 Sheet 2 From 23 deg 40 min North Latitude to Old Bahama Channel
        • 2065 Northern Antigua
        • 2133 Approaches to Suez Bay (Bahr el Qulzum)
        • 2373 Bahr el Qulzum (Suez Bay) to Ras Sheratib
        • 2374 Ra's Sharatib to Juzur Ashrafi
        • 2441 Jazireh-ye Tonb-e Bozorg to Jazireh-ye Forur
        • 2658 Outer Approaches to Mina` al Jeddah (Jiddah)
        • 2837 Strait of Hormuz to Qatar
        • 2847 Qatar to Shatt al `Arab
        • 2887 Dubai (Dubayy) and Jazireh-Ye Qeshm to Jazirat Halul
        • 2888 Jask to Dubayy and Jazireh-ye Qeshm
        • 2889 Dubayy to Jabal Az Zannah and Jazirat Das
        • 3043 Red Sea, Ports on the coast of Egypt.
        • 3102 Takoradi and Sekondi Bays
        • 3172 Strait of Hormuz
        • 3174 Western Approaches to the Strait of Hormuz
        • 3175 Jazirat al Hamra' to Dubai (Dubayy) and Jazireh-ye Sirri
        • 3179 UAE and Qatar, Jazirat Das to Ar Ru' Ays
        • 3310 Africa - east coast, Mafia Island to Pemba Island
        • 3361 Wasin Island to Malindi
        • 3432 Saltpond to Tema
        • 3493 Red Sea - Sudan, Bashayer Oil Terminals and Approaches.
        • 3519 Southern Approaches to Masirah
        • 3520 Khawr Kalba and Dawhat Diba to Gahha Shoal
        • 3522 Approaches to Masqat and Mina' al Fahl
        • 3530 Approaches to Berbera
        • 3709 Gulf of Oman, United Arab Emirates, Port of Fujairah (Fujayrah) and Offshore Terminals.
        • 3723 Gulf of Oman, United Arab Emirates, Approaches to Khawr Fakkan and Fujairah (Fujayrah).
        • 3775 Ra's Abu `Ali to Ra's as Saffaniyah
        • 3785 Mina' Raysut to Al Masirah
        • 3907 Bahama Islands and Hispaniola, Passages between Mayaguana Island and Turks and Caicos Islands.
        • 3908 Passages between Turks and Caicos Islands and Dominican Republic
        • 3910 Little Bahama Bank including North West Providence Channel
        • 3912 Bahamas, North East Providence Channel and Tongue of the Ocean
        • 3913 Bahamas, Crooked Island Passage and Exuma Sound
        • 3914 Turks and Caicos Islands and Bahamas, Caicos Passage and Mayaguana Passage
        • 3951 Sir Bani Yas to Khawr al `Udayd


        Don't forget to visit the UKHO Notices to Mariners : NTM for 2012

        So today, for a cost of 9.9 € / month ('Premium Charts' subscription), you can have access to 2588 additional updated charts (4332 including sub-charts) coming from 3 international Hydrographic Services (UKHO, CHS, AHS and France).

      NZ Linz update in the Marine GeoGarage


      7 charts have been updated in the Marine GeoGarage
      (Linz May published 5 June 2012 & June published 4 July 2012 updates)

        • NZ48 Western approaches to Cook Strait
        • NZ58 Castle Point to Cape Palliser
        • NZ232 Lake Taupo
        • NZ443 Approaches to Port Taranaki
        • NZ5412 Port of Tauranga
        • NZ6821 Bull Harbour and Entrance : port of Bluff
        • NZ14900 Ross Sea

        Today NZ Linz charts (178 charts / 340 including sub-charts) are displayed in the Marine GeoGarage.

        Note :  LINZ produces official nautical charts to aid safe navigation in New    Zealand waters and certain areas of Antarctica and the South-West    Pacific.

        Using charts safely involves keeping them up-to-date using Notices to Mariners

        Outdoors tip of the week: bowline knot more than a boater's best friend


        Last week a friend untied a line that had been fastened to the bow of his boat for four years.
        Called a bowline for obvious reasons, it took only seconds and finger pressure to open a knot invented centuries ago by sailors who needed to tie or free a line quickly.

        The bowline is the most useful knot for any sailor, and it also should be learned by campers, hunters, anglers and anyone else who does outdoor activities.

        Its biggest virtue is that, properly tied, it never gets so tight that you can't open it.
        Its biggest drawback is that it can be hard to open under a load, but on balance it's useful for everything from mooring a boat to tying two lines together.

        When I visit marinas, I'm often stunned by the amazing lack of knot skills most boaters demonstrate.
        Many never seem to figure out that even a simple mooring hitch around a cleat will jam if you wrap it the wrong way.

        Most of the time a knot that jams or comes loose is only an inconvenience, but it can cause a costly accident or result in people being injured or killed.
        I knew a man who drowned after his boat swamped when he couldn't release a jammed anchor line in a big sea.

        Boaters at least should learn to tie a bowline, clove hitch, trucker's hitch and a proper square knot.

        Experienced sailors may suggest others, but those four will give boaters the ability to deal with most situations that require them to tie a line to something, free one quickly or lash something down.

        These are the best knots for specific tasks on any sailing vessel.
        These are also the knots taught by Coastguard Boating Education NZ :
        Figure of Eight Knot / Reef Knot / Clove Hitch / Double Sheet Bend
        Bowline / Rolling Hitch /Round Turn and Two Half Hitches / Fisherman's Bend & Anchor Bend

        You can learn how to tie knots from thousands of sites on the Internet, many with step-by-step videos.
        A great book is "Knots: The Complete Visual Guide," by Des Pawson, with more than 100 knots, bends, hitches loops and splices in 400 pages filled with excellent illustrations.

        If you can't be bothered learning to do it right, you always can follow the advice that America's Cup sailor Gary Jobson once offered as we watched a power boater fumbling with his mooring lines at a dock:

        "If you can't tie good knots, tie lots of 'em."

        Links :

        Thursday, July 26, 2012

        ‘Mantabot’ vehicle swims like a ray

        "Biology has solved the problem of locomotion with these animals, so we have to understand the mechanisms if we are going to not only copy how the animal swims, but possibly even to improve upon it," says Hilary Bart-Smith.

        From Futurity

        Batoid rays, such as stingrays and manta rays, are among nature’s most elegant swimmers. They are fast, highly maneuverable, graceful, energy-efficient, and can cruise, bird-like, for long distances in the deep, open ocean, and rest on the sea bottom.

        “They are wonderful examples of optimal engineering by nature,” says Hilary Bart-Smith, an associate professor of mechanical and aerospace engineering in the University of Virginia‘s School of Engineering and Applied Science.

        They are designing an “autonomous underwater vehicle” that someday may surpass what nature has provided as a model.
        The vehicle has potential commercial and military applications, and could be used for undersea exploration and scientific research.

        Swimming with a Manta Ray

        Copying nature

        Sometimes called “biomimicry”—the attempt to copy nature—Bart-Smith calls her work “bio-inspired.”
        “We are studying a creature to understand how it is able to swim so beautifully, and we are hoping to improve upon it,” she says.
        “We are learning from nature, but we also are innovating; trying to move beyond emulation.”

        Bart-Smith’s team, which includes researchers at University of Virginia, Princeton University, the University of California, Los Angeles, and West Chester University, are modeling their mechanical ray on the cow-nosed ray, a species common to the western Atlantic and Chesapeake Bay.
        The team members, who are experts in marine biology, biomechanics, structures, hydrodynamics and control systems, have created a prototype molded directly from a real cow-nosed ray.

        By studying the motions of living rays in the field and the laboratory and through dissection, this prototype attempts to replicate the near-silent flaps of the wing-like pectoral fins of a ray, to swim forward, turn, accelerate, glide, and maintain position.
        “Biology has solved the problem of locomotion with these animals, so we have to understand the mechanisms if we are going to not only copy how the animal swims, but possibly even to improve upon it,” Bart-Smith says.
        Her team is trying to achieve optimal silent propulsion with a minimum input of energy.

        Stealth tracking

        Researchers remotely control the mechanical ray via computer commands.
        The plastic body of the vehicle contains electronics and a battery, while the flexible silicone wings contain rods and cables that expand and retract and change shape to facilitate what is essentially underwater flight.
        Bart-Smith’s ultimate goal is to engineer a vehicle that would operate autonomously, and could be deployed for long periods of time to collect undersea data for scientists, or as a surveillance tool for the military.
        It also could be scaled up, or down, to serve as a platform carrying various payloads, such as environmental monitoring instruments.
        For example, it possibly could be used for pollution monitoring, such as tracking the locations of underwater oil spills.
        And because the vehicle looks and behaves like a common sea creature, it likely would operate in the sea without affecting natural creatures or their habitats.
        The research is funded by the Office of Naval Research through its Multidisciplinary University Research Initiative Program, the National Science Foundation, and the David and Lucile Packard Foundation.

        Links :
        • InnovationNewsDaily : How 'antabot' robot fish could help Navy missions
        • ACS : The first robot that mimics the water striders’ jumping abilities 
        • BBC : Artificial jellyfish created from heart cells

        Wednesday, July 25, 2012

        Satellites see unprecedented Greenland ice sheet surface melt

        Extent of surface melt over Greenland’s ice sheet on July 8 (left) and July 12 (right).
        Measurements from three satellites showed that on July 8, about 40 percent of the ice sheet had undergone thawing at or near the surface.
        In just a few days, the melting had dramatically accelerated and an estimated 97 percent of the ice sheet surface had thawed by July 12.
        In the image, the areas classified as “probable melt” (light pink) correspond to those sites where at least one satellite detected surface melting.
        The areas classified as “melt” (dark pink) correspond to sites where two or three satellites detected surface melting.
        The satellites are measuring different physical properties at different scales and are passing over Greenland at different times.
        As a whole, they provide a picture of an extreme melt event about which scientists are very confident.
        Credit: Nicolo E. DiGirolamo, SSAI/NASA GSFC, and Jesse Allen, NASA Earth Observatory

        From NASA

        For several days this month, Greenland's surface ice cover melted over a larger area than at any time in more than 30 years of satellite observations.
        Nearly the entire ice cover of Greenland, from its thin, low-lying coastal edges to its two-mile-thick center, experienced some degree of melting at its surface, according to measurements from three independent satellites analyzed by NASA and university scientists.

         Concerning: Icebergs float in a bay off Ammassalik Island, Greenland, in 2007.

        On average in the summer, about half of the surface of Greenland's ice sheet naturally melts.
        At high elevations, most of that melt water quickly refreezes in place.
        Near the coast, some of the melt water is retained by the ice sheet and the rest is lost to the ocean.
        But this year the extent of ice melting at or near the surface jumped dramatically.
        According to satellite data, an estimated 97 percent of the ice sheet surface thawed at some point in mid-July.

        Researchers have not yet determined whether this extensive melt event will affect the overall volume of ice loss this summer and contribute to sea level rise.

         Closeup of the Ice Island from Petermann Glacier (NASA)

        "The Greenland ice sheet is a vast area with a varied history of change.
        This event, combined with other natural but uncommon phenomena, such as the large calving event last week on Petermann Glacier, are part of a complex story," said Tom Wagner, NASA's cryosphere program manager in Washington.
        "Satellite observations are helping us understand how events like these may relate to one another as well as to the broader climate system."
        Son Nghiem of NASA's Jet Propulsion Laboratory in Pasadena, Calif., was analyzing radar data from the Indian Space Research Organisation's (ISRO) Oceansat-2 satellite last week when he noticed that most of Greenland appeared to have undergone surface melting on July 12. Nghiem said,
        "This was so extraordinary that at first I questioned the result: was this real or was it due to a data error?"
        Nghiem consulted with Dorothy Hall at NASA's Goddard Space Flight Center in Greenbelt, Md. Hall studies the surface temperature of Greenland using the Moderate-resolution Imaging Spectroradiometer (MODIS) on NASA's Terra and Aqua satellites.
        She confirmed that MODIS showed unusually high temperatures and that melt was extensive over the ice sheet surface.

        Thomas Mote, a climatologist at the University of Georgia, Athens, Ga; and Marco Tedesco of City University of New York also confirmed the melt seen by Oceansat-2 and MODIS with passive-microwave satellite data from the Special Sensor Microwave Imager/Sounder on a U.S. Air Force meteorological satellite.

        Footage taken during the filming of 'A GLIMPSE of Greenland'

        The melting spread quickly.
        Melt maps derived from the three satellites showed that on July 8, about 40 percent of the ice sheet's surface had melted.
        By July 12, 97 percent had melted.

        This extreme melt event coincided with an unusually strong ridge of warm air, or a heat dome, over Greenland.
        The ridge was one of a series that has dominated Greenland's weather since the end of May.
        "Each successive ridge has been stronger than the previous one," said Mote.
        This latest heat dome started to move over Greenland on July 8, and then parked itself over the ice sheet about three days later.
        By July 16, it had begun to dissipate.

        Even the area around Summit Station in central Greenland, which at 2 miles above sea level is near the highest point of the ice sheet, showed signs of melting.
        Such pronounced melting at Summit and across the ice sheet has not occurred since 1889, according to ice cores analyzed by Kaitlin Keegan at Dartmouth College in Hanover, N.H.
        A National Oceanic and Atmospheric Administration weather station at Summit confirmed air temperatures hovered above or within a degree of freezing for several hours July 11-12.

        "Ice cores from Summit show that melting events of this type occur about once every 150 years on average. With the last one happening in 1889, this event is right on time," says Lora Koenig, a Goddard glaciologist and a member of the research team analyzing the satellite data
        "But if we continue to observe melting events like this in upcoming years, it will be worrisome."

        Nghiem's finding while analyzing Oceansat-2 data was the kind of benefit that NASA and ISRO had hoped to stimulate when they signed an agreement in March 2012 to cooperate on Oceansat-2 by sharing data.

        Links :
        • BBC : Satellites reveal sudden Greenland ice melt
        • OSU :  GPS GNET network can now measure ice melt, change in Greenland over months rather than years