This is the fourth digital grid of the Arctic to be published since IBCAO was established in St Petersburg in 1997.
Since 2012, when the third IBCAO was compiled, numerous icebreaker expeditions mapping the seafloor have been completed.
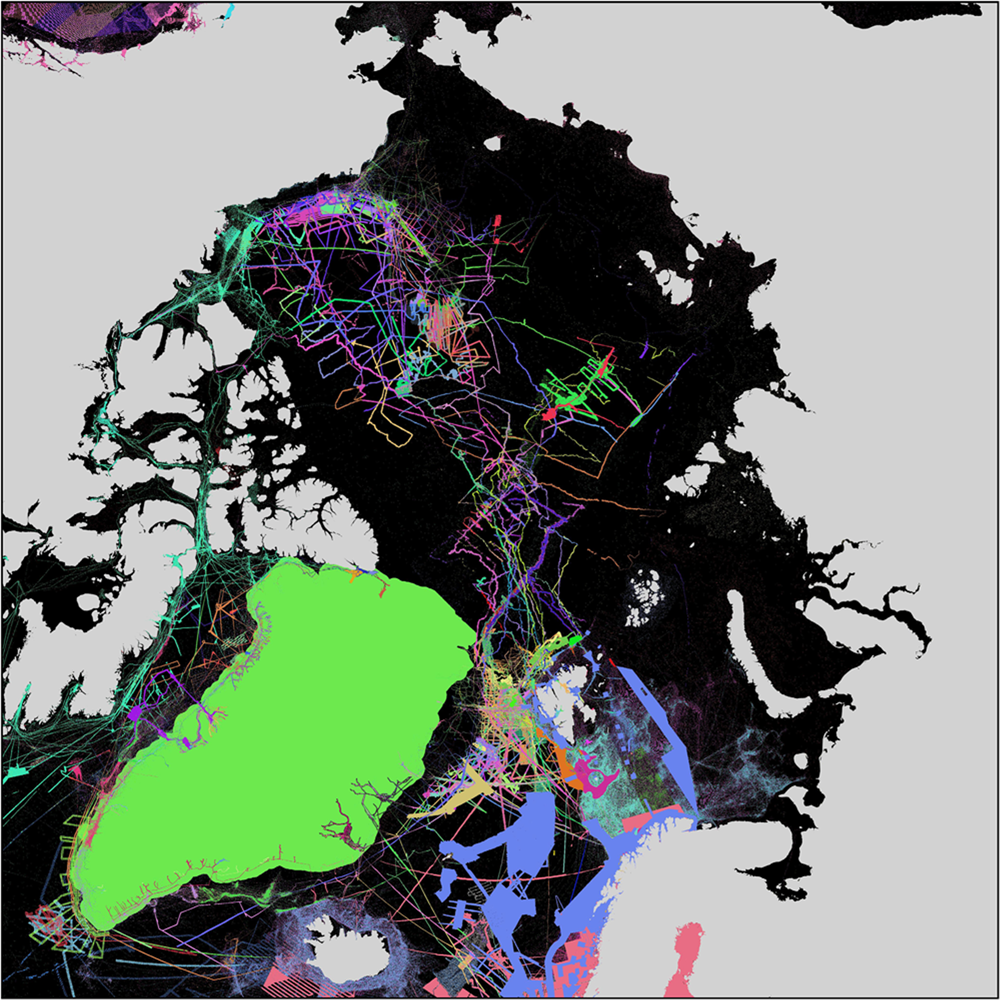
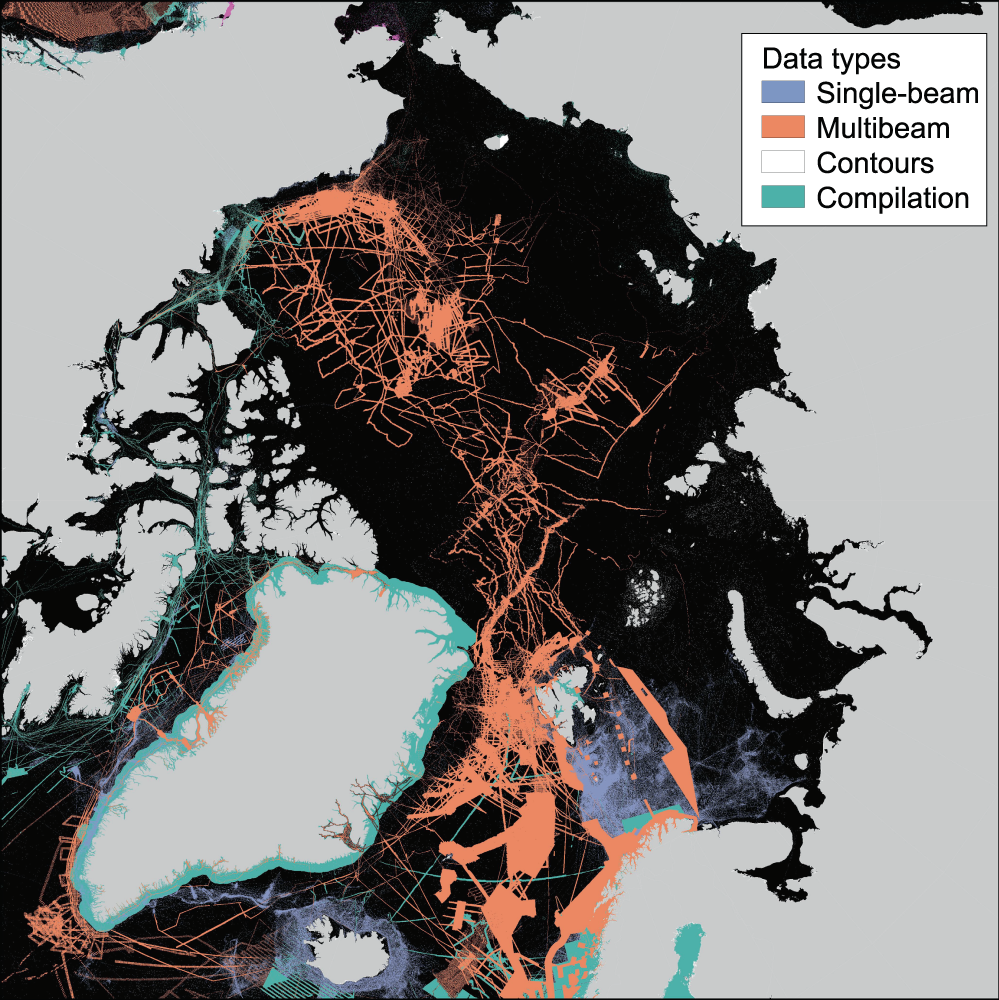
The IBCAO grids have had hundreds of thousands of downloads over the years and are used in all bathymetric applications for the Arctic.Map showing the underlying sources, 4 based on the Source Identification Grid (SID).
[Source: The International Bathymetric Chart of the Arctic Ocean Version 4.0]
From Phys by University of Barcelona
An international team of researchers has published the most detailed submarine map of the Arctic Ocean. The study, by Miquel Canals, José Luis Casamor and David Amblàs from the Consolidated Research Group on Marine Geosciences of the University of Barcelona, has been published in Scientific Data.

The map is the 4.0 version of the International Bathymetric Chart of the Arctic Ocean (IBCAO), an initiative that was created in 1997 in Saint Petersburg (Russia) in order to map the depths of the Arctic floor.
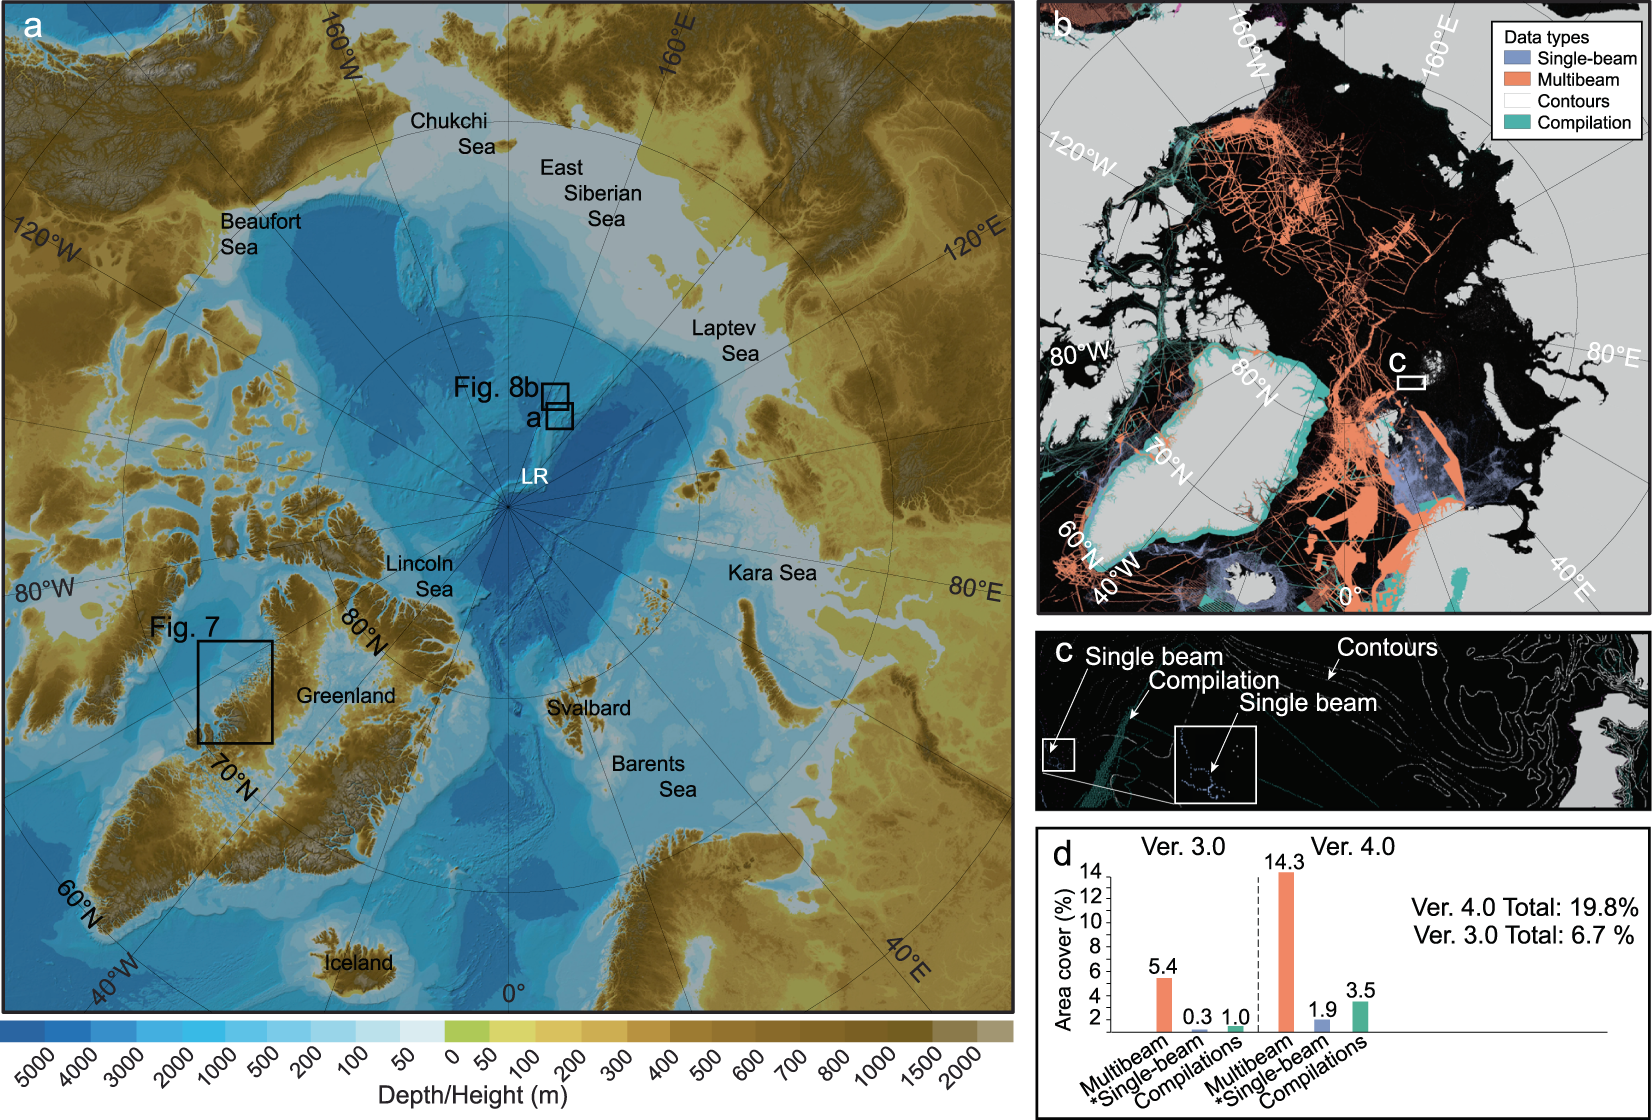
Published in digital format, the new chart expands up to 19.6% the submarine surface mapped in previous versions.


The map is the 4.0 version of the International Bathymetric Chart of the Arctic Ocean (IBCAO).
Details of a new depth map of the Arctic Ocean have been published in the Nature Journal Scientific Data.
The new portrayal of the Arctic Ocean floor is in the form of a digital gridded database and comprises Version 4.0 of the International Bathymetric Chart of the Arctic Ocean (IBCAO).
The new bathymetric chart of the Arctic Ocean
The northernmost ocean of the planet, and also the smallest and shallowest one, plays a decisive role in the regulation of the planet's climate, and it is the most sensitive polar region to the effects of global warming.
According to some predictions, the progressive loss of the marine ice layers could open navigation to some areas that were previously inaccessible, such as the Northwest Passage, the legendary marine route pursued by many 19th century expeditions, joining the boreal Pacific and Atlantic oceans.
"The potential difficulty for the current science campaigns in the Arctic is the access to places which are permanently covered by marine ice, and the short-lived duration of the navigation period. However, global warming made these inaccessible areas easier to reach now," says Professor Miquel Canals, head of the Consolidated Research Group on Marine Sciences of the UB.
Since 2018, the team has contributed to the 4.0 IBCAO map with data mainly obtained through the multibeam bathymetry in oceanographic campaigns in the Arctic, specially in the western area in the Barents Sea, "a volunteering collaboration to benefit science and knowledge," Miquel Canals says.
In its different editions, the IBCAO maps received thousands of downloads over the years and are widely used by governments, companies and researchers with scientific interest and activities in the Arctic.
The new cartography has a volume with a higher and better resolution data than the previous versions, and it includes marine regions which were unknown to date.
"This results from the efforts made by an international collaborative of many institutions and researchers who provided their scientific data to reach a common objective: discovering the depths of the Arctic Ocean," says Canals.

Multibeam probes and nuclear submarine under the Arctic ice
In order to carry out the IBCAO 4.0 map, the team used the same technology used in the submarine study in other regions of the ocean.
"The compounds of the new map, mainly the most recent ones, were obtained through the most advanced multibeam bathymetry systems that exist. These data come from oceanographic vessels, ice breakers and nuclear submarines, the only ones to map those areas under the iced sea, impossible to reach with other ships," says Canals.
"Regarding the data processing and fusion –with a new Mallat algorithm–, new techniques were added, and provided an excellent result."
Ocean currents, climate regulation and stability of ocean floors
In general, a better and larger cartography helps to broaden the knowledge of the geological and glacial evolution of such a sensitive region like the Arctic.
Therefore, the new bathymetric map identifies a great variety of the shapes of the relief with glacial origins, "some at large scales—from hundreds to thousands of meters in length—that show the direction of the movement of the ice on the ocean floors, which helps to reconstruct the geological processes of the recent past in arctic latitudes."
Bathymetrical data are relevant in other fields of polar science, such as the study of the path of ocean currents, and therefore, the distribution of the heat, the sea-ice decline, the effect of inflowing warm waters on tidewater glaciers, and the stability of marine based ice streams and outlet glaciers grounded on the seabed.
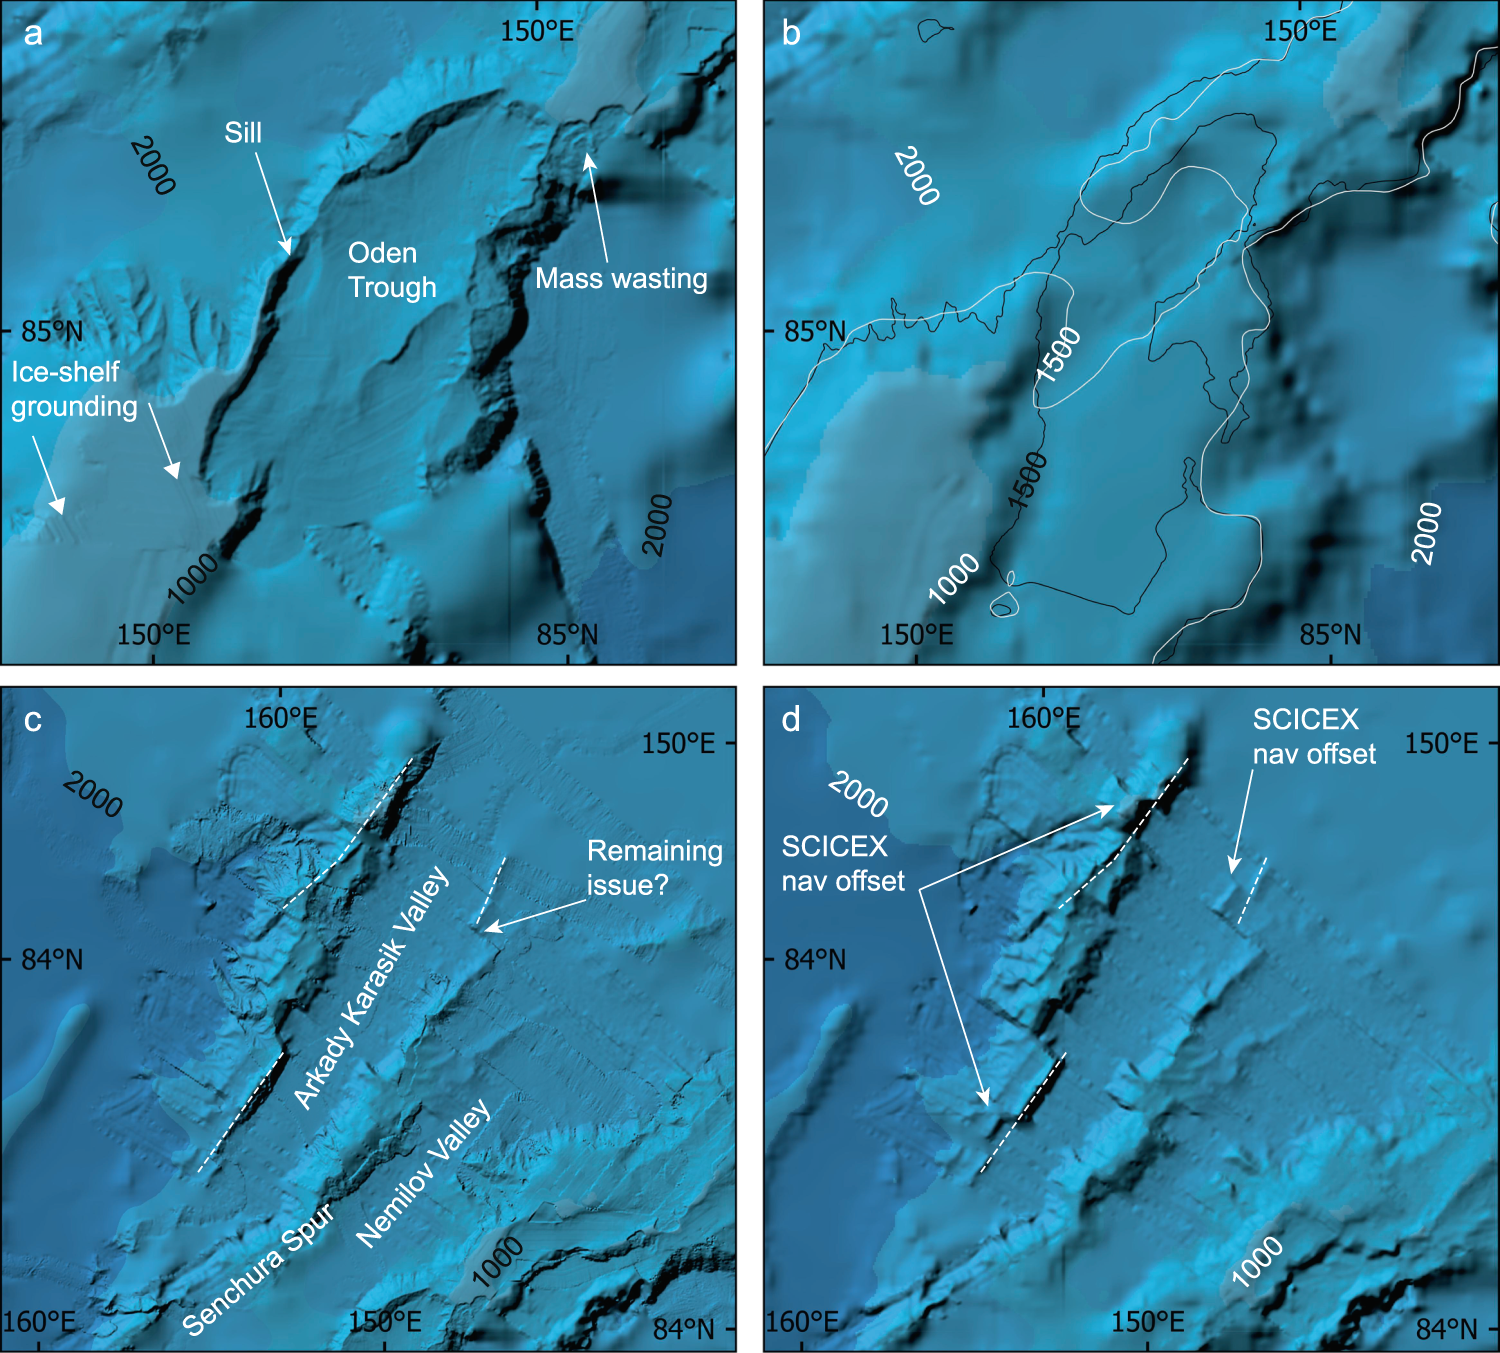
One of the most spectacular formations in the Arctic ocean floors is the Lomonosov Ridge, a geological element with more than 1,600 kilometers of length "which connects Northern Greenland and Siberia and crosses the ocean leaving deep basins in both sides," says Canals.
"The most recent cartography studies carried out with ice breakers, revealed the presence of thresholds that influence the exchange of water between both basins, and anchoring marks in ice platforms on the ridge."
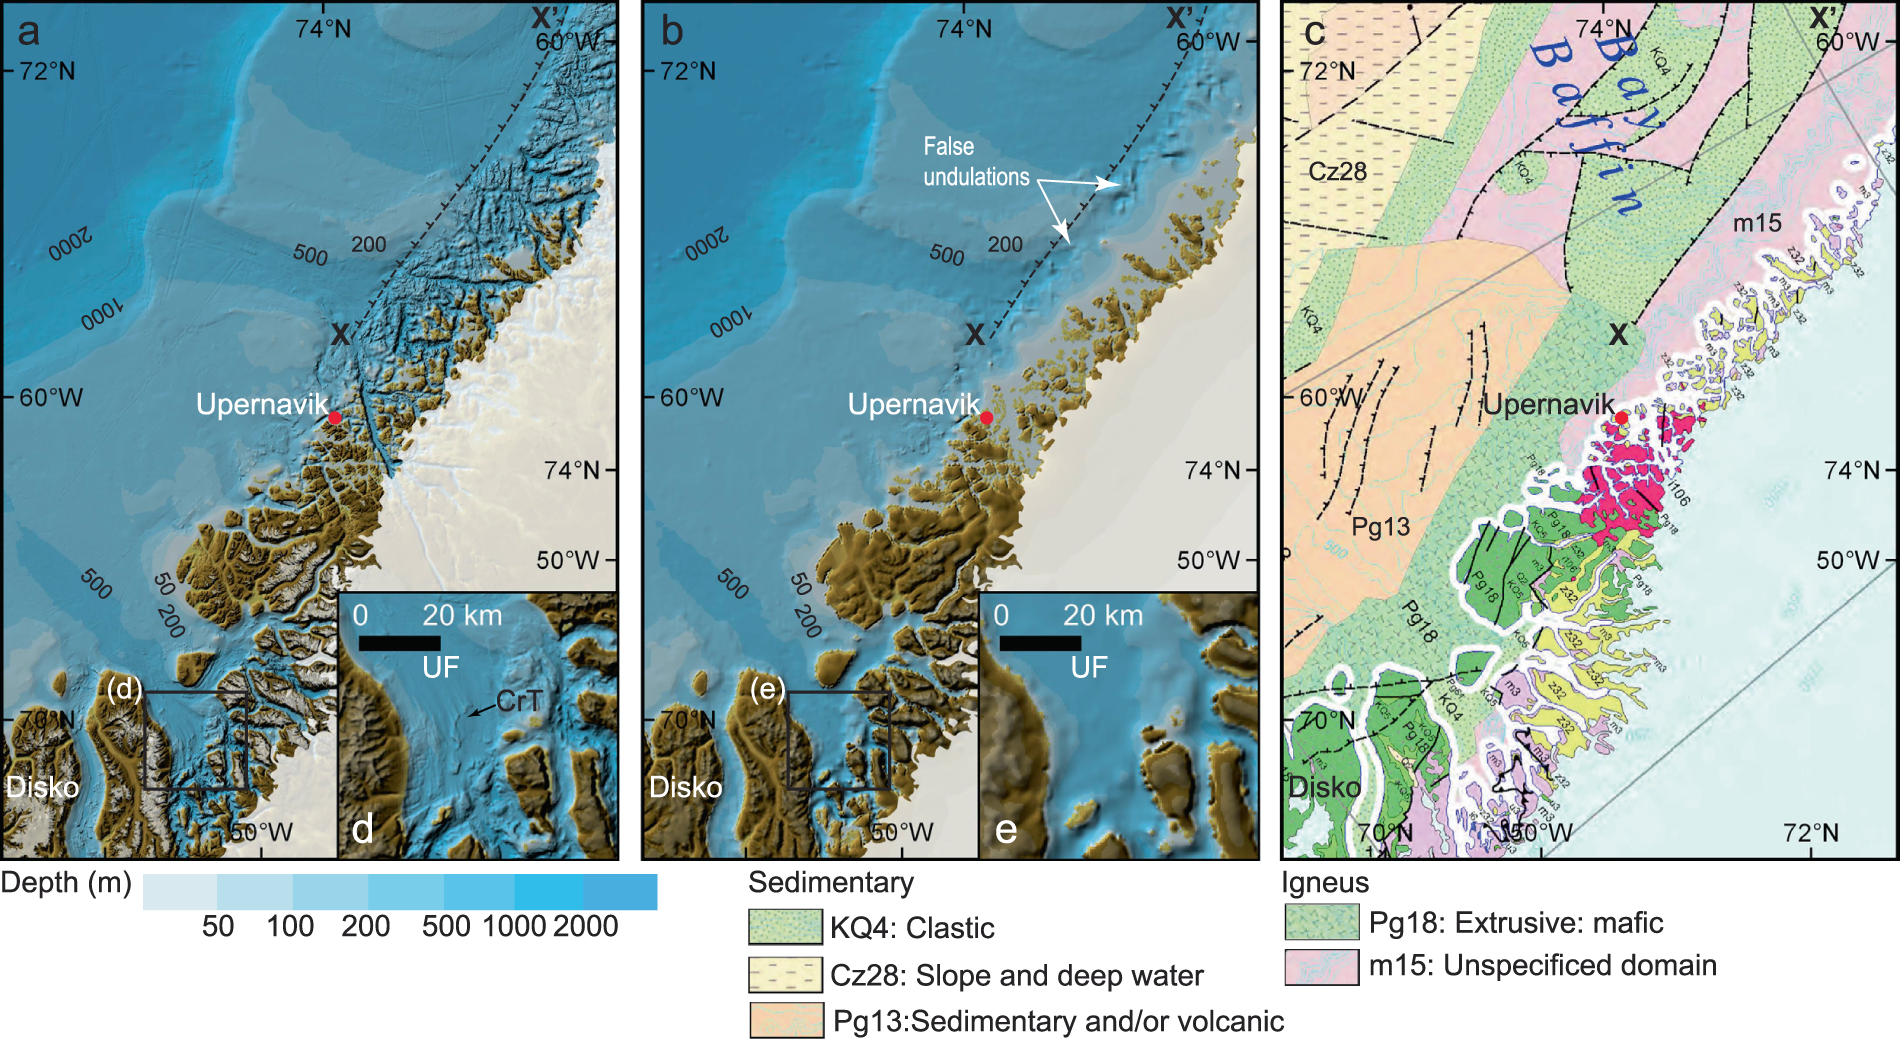
The IBCAO 4.0 bathymetric chart also reveals the detailed map of the Greenland fjords, and provides data of interest for the development of predictive models on the behavior of the ice sheet, currently undergoing a rapid recession, which covers the island and on the sea level rise worldwide.
The challenge of mapping marine floors worldwide
To date, researchers have mapped about one-fifth of the ocean floors worldwide.
Knowing the submarine relief of the global ocean is essential to manage and protect the marine and coastal ecosystems, as stated in one of the objectives of the U.N. Sustainable Development Goals (SDG), approved by the General Assembly in 2015.
Within the frame of the international effort to study the Arctic marine floors, the Consolidated Research Group on Marine Geosciences of the UB is one of the teams that take part in the Nippon Foundation-GEBCO Seabed 2030, the most ambitious global project to complete a great task in marine geosciences: high-resolution submarine bathymetry in all oceans worldwide.
The gridded compilation has been completed under the auspices of the Regional Center for the Arctic and North Pacific Ocean of The Nippon Foundation-GEBCO Seabed 2030 Project.
This Regional Center is one of four Seabed 2030 centers covering the world ocean and is run jointly by Stockholm University and the University of New Hampshire.
Scientists and map-makers from 15 countries participated in the work, including all circum-Arctic nations.
Links :
No comments:
Post a Comment