To celebrate World Environment Day, Google Arts & Culture and the UNFCCC are announcing "Heartbeat of the Earth", a series of new experimental artworks that offer everyone a new perspective to explore issues related to the climate crisis.
Google Arts & Culture worked with five artists who created four experiments/artworks that address one or more of the key findings of the landmark 2018 United Nations IPCC report and data from global scientific institutions such as the National Oceanic and Atmospheric Administration and the World Meteorological Organization.
The artists have interpreted the evidence and transformed it into striking and accessible visualizations or scenarios that help you learn more interactively about sea level rise, glacier retreat, food-related CO2 production or ocean acidification.
By supporting artists who explore scientific climate data, creating experimental artworks that engage the public in new ways to address the climate issues we face, Google Arts & Culture continues to support experimentation in art and technology.
Find the four interactive experiments / "climate artworks" below:
Coastline Paradox - Artists Timo Aho and Pekka Niittyvirta (FIN) invite the viewer to explore a world where sea levels are rising and instability is increasing as we move into the future. -
A map and Street View experience visualizing the actual and predicted rise in sea level caused by the climate crisis.
See, for example, the effect this will have in our country by searching for "Belgium" in the search bar.
Timelines - Photographs of spectacular landscapes taken by artist Fabian Oefner (CH) who used precise digital coordinates from ETH data, linking them to Google Earth terrain to visualize the retreat of glaciers and choose where he would take the photos from.

What We Eat - An interactive online artwork to engage people in activities that show the CO2 footprint of individual foods and diets.
The work by Laurie Frick (USA) visually explores the impact of individual diets, using US, UK and French data to expose the disparity in CO2 consumption between foods.
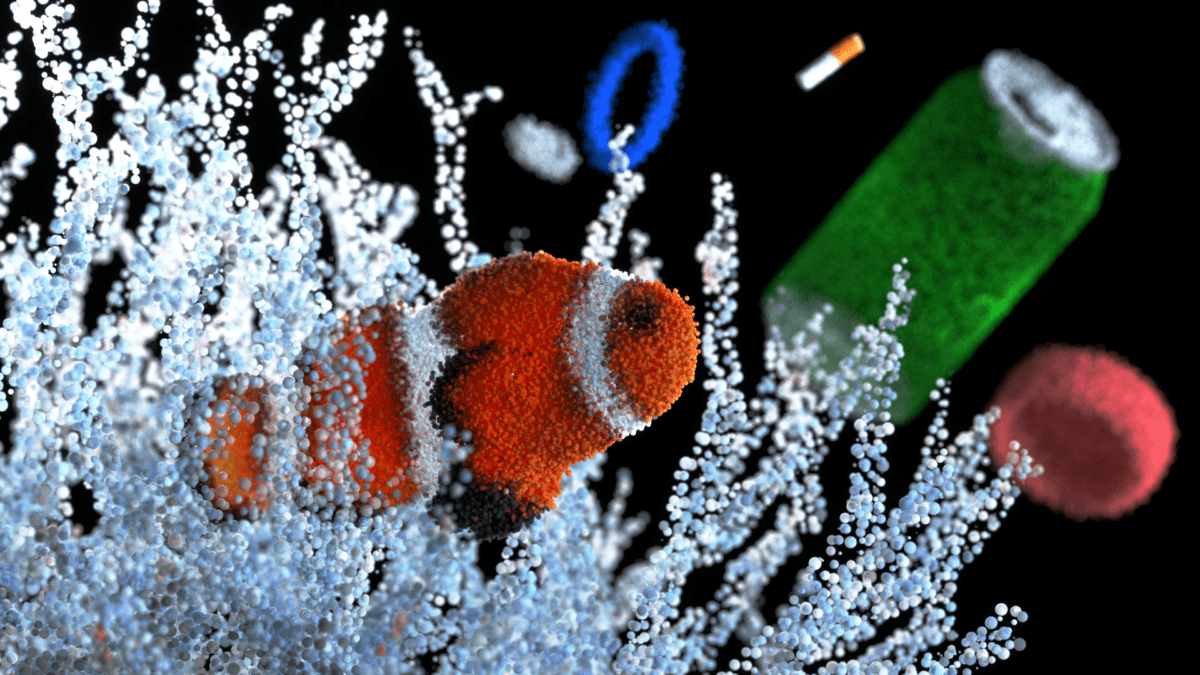
Diving into the acidifying oceans - An interactive visualization of the data invites you to dive into the ocean and explore the impact of rising temperatures and, consequently, CO2 levels on marine life over time, using the cloud point.
No comments:
Post a Comment