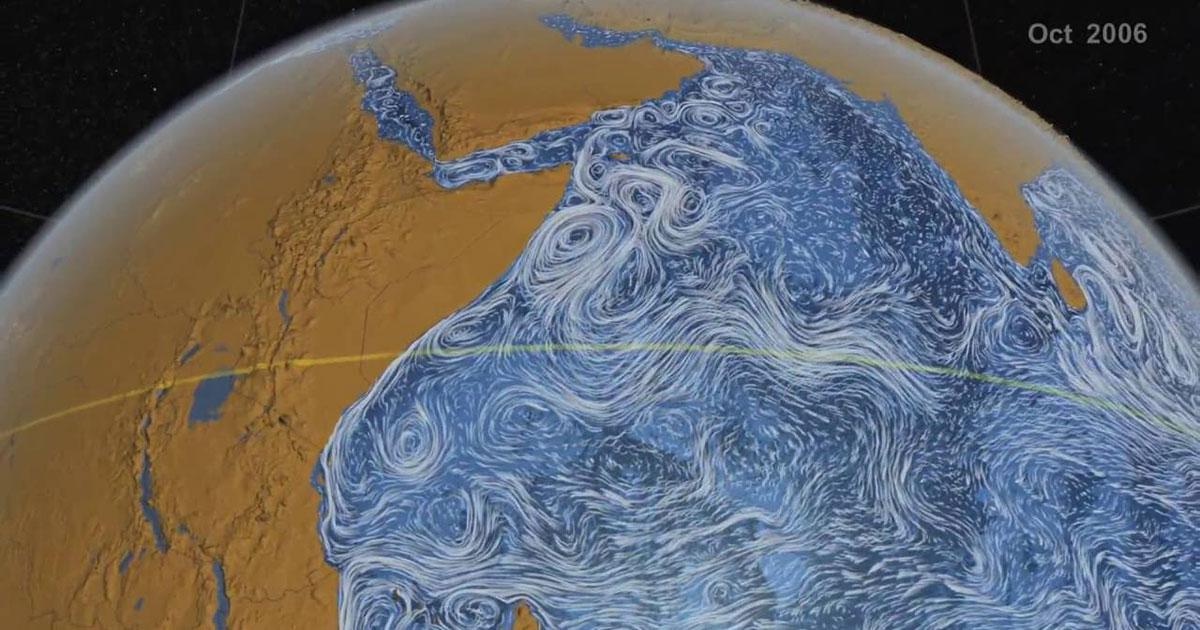
Researchers have found a new way to use satellites to monitor the Great Whirl, a massive whirlpool the size of Colorado that forms each year off the coast of East Africa, shown here in a visualization of ocean currents in the Indian Ocean.
Credit: NASA Scientific Visualization Studio
From LiveScience by Mindy Weisberger
An enormous ocean whirlpool the size of Colorado appears every spring off the coast of Somalia, and it's so big, scientists can see it from space.
Satellite data recently revealed it's even bigger and lasts longer than once thought.

Findley said that its whirling created "a very heavy confused sea," and recommended that sailors avoid its powerful currents when approaching the African coast.
What causes the Great Whirl?
While the monsoon winds are thought to play a part, the vortex starts to form in April, about two months before the onset of the monsoon, and it persists for more than a month after the monsoon subsides in September or October, according to a study published in the journal Geophysical Research Letters in 2013.

Annual absolute dynamic topography variance (m2) in the Arabian Sea.
The black box indicates the domain used for Great Whirl tracking in this study (5–10°N, 50–55°E).
The whirlpool starts to spin with the arrival of annual Rossby waves in the Indian Ocean.
These slow-moving waves, which measure just a couple of inches in height, carry reservoirs of stored energy that fuel the vortex.
Once the vortex is awhirl, the monsoon winds arrive and keep it spinning; at its peak, the Great Whirl can expand to over 300 miles (500 kilometers) wide, according to the 2013 study.

Qualitative results of this study's algorithm in (a) June, (b) August, and (c) October 2012, compared to methods implemented on the Great Whirl in the past.
Absolute dynamic topography is shaded, and HYbrid Coordinate Ocean Model surface current vectors are overlayed.
Colored contours indicate each method: black = this study; blue = 35‐cm sea surface height threshold; green = 6‐cm sea surface height amplitude; red = streamline; magenta = −1.5 × 10⁻¹² Okubo‐Weiss threshold.
The selection of dates coincides with the formation date according to our algorithm (11 June) and subsequent steps at 2‐month interval.
Still, researching it in greater depth has proved to be challenging.
Because the vortex is so big, it behaves differently than smaller whirlpools.
Efforts to study it have also been hampered by pirates who operate near the Somali coast, according to a new study.
Researchers have found a new way to use satellites to monitor the Great Whirl, a massive whirlpool the size of Colorado that forms each year off the coast of East Africa.
This animation tracks the Great Whirl from May to December of 2000.
The color of the water represents sea levels - the redder the color, the higher the seas.
The black outline represents the new algorithm used for identifying the Great Whirl, and the white stars indicate the highest sea levels within the Whirl.
The animation starts before the Whirl forms and ends after it disappears.
After forming, most fluctuations are due to smaller eddies traveling east to west that are absorbed along the eastern edge of the Whirl.
The new method for identifying the Whirl is an improvement over past methods because it can potentially identify the Whirl before it's completely organized and it avoids classifying the disappearance and rapid re-emergence events as two distinct eddies, when in fact they are one and the same.
Credit: Bryce Melzer.
Observations from above
Scientists suspected that satellite data could provide insights into the Great Whirl.
They analyzed satellite observations spanning 23 years, and examined 22 years of ocean circulation models.
From that data, they developed a computer program that could identify the fingerprints of the vortex and track it over time.
They also analyzed sea level data, as the center of the whirlpool rises to form a mound that is higher than the ocean surrounding it.
In the new study, scientists determined that the whirlpool typically lasts for about 198 days — far longer than previous estimates of 140 days and 166 days.
It also ended months later than expected, prevailing through December and even into January in some cases.
And when the Great Whirl was at its most intense, it covered 106,000 square miles (275,000 square kilometers) on average, the study authors reported.
As the Great Whirl is linked to the onset of the monsoon, the new algorithm could also be used to detect patterns that shape monsoon formation.
This could help to forecast the amount of rainfall that the seasonal event brings to India, which affects agriculture across the country, lead study author Bryce Melzer, a satellite oceanographer at Stennis Space Center in Mississippi, said in a statement.
"If we're about to connect these two, we might have an advantage in predicting the strength of the monsoon, which has huge socioeconomic impacts," Melzer said.
Their findings were published online April 30 in the journal Geophysical Research Letters.
Links :
- The Weather Channel : Whirlpool the Size of Colorado Now Tracked From Space, Study Says
- ON&T : Scientists Track Giant Ocean Vortex from Space
No comments:
Post a Comment