
A MERMAID undergoes testing off Japan's coast in 2018
photo : Alex Burky / Princeton University
From ScienceMag by Erik Stokstad
A versatile, low-cost way to study Earth's interior from sea has yielded its first images and is scaling up.
By deploying hydrophones inside neutrally buoyant floats that drift through the deep ocean, seismologists are detecting earthquakes that occur below the sea floor and using the signals to peer inside Earth in places where data have been lacking.
In February, researchers reported that nine of these floats near Ecuador's Galápagos Islands had helped trace a mantle plume—a column of hot rock rising from deep below the islands.
Now, 18 floats searching for plumes under Tahiti have also recorded earthquakes, the team reported last week at the European Geosciences Union (EGU) meeting here.
"It seems they've made a lot of progress," says Barbara Romanowicz, a geophysicist at the University of California, Berkeley.
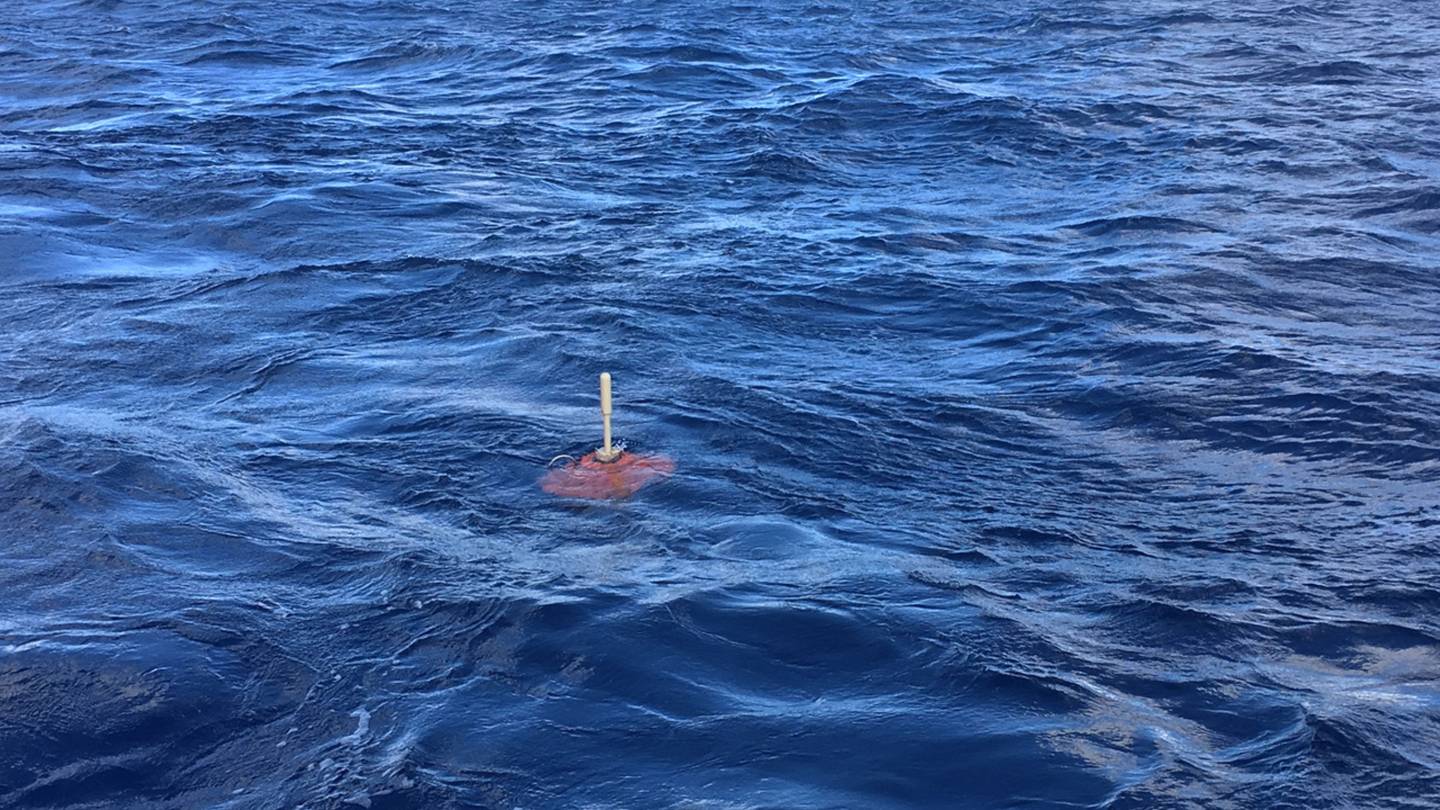
A MERMAID recently launched near Tahiti is sending messages to the satellite before diving a mile underwater to begin monitoring for earthquake signals.
Photo by Frederik Simons, Department of Geosciences
Photo by Frederik Simons, Department of Geosciences
The South Pacific fleet will grow this summer, says Frederik Simons, a seismologist at Princeton University who helped develop the floats, called MERMAIDs (mobile earthquake recorders in marine areas by independent divers).
He envisions a global flotilla of thousands of these wandering devices, which could also be used to detect the sound of rain or whales, or outfitted with other environmental or biological sensors.
"The goal is to instrument all the oceans."
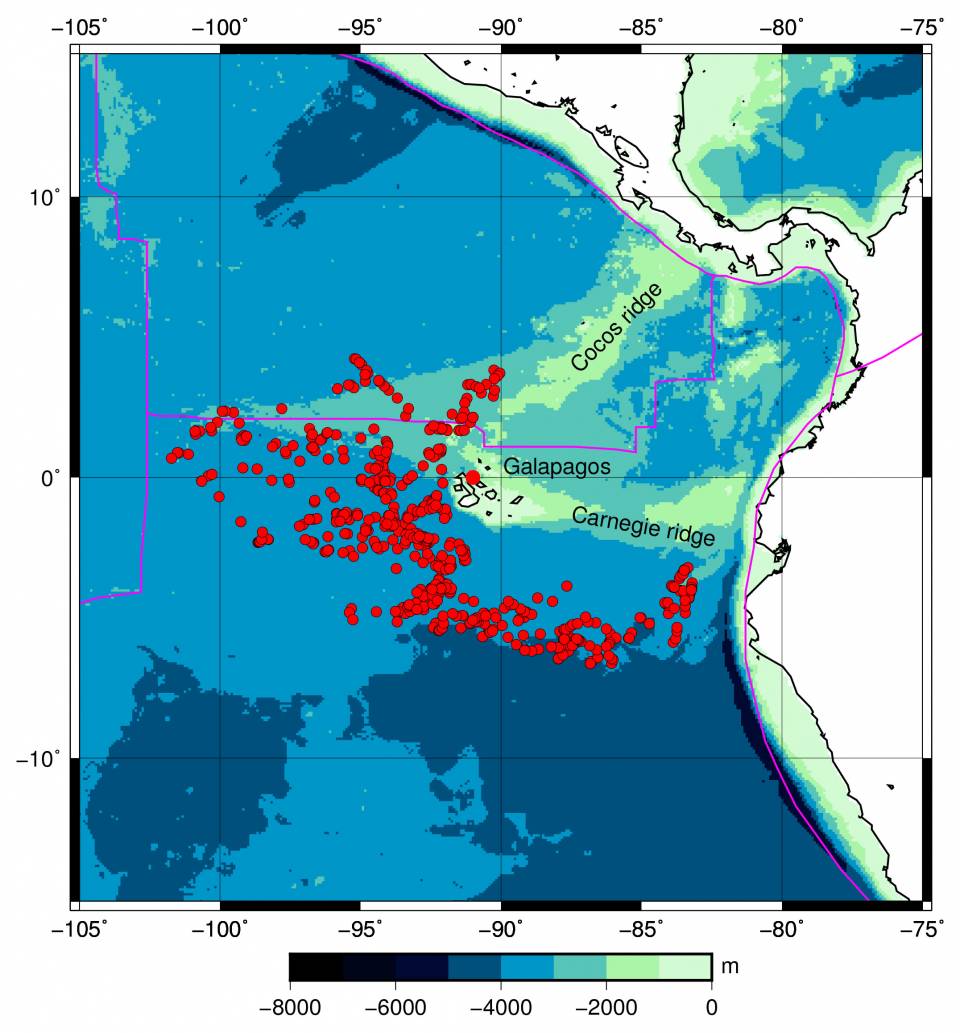
Drifting a mile below the surface, MERMAIDs cover a large area. The red circles show where a MERMAID picked up a seismic signal.
Image courtesy of the researchers
Image courtesy of the researchers
For decades, geologists have placed seismometers on land to study how powerful, faraway earthquakes pass through Earth.
Deep structures of different density, such as the cold slabs of ocean crust that sink into the mantle along subduction zones, can speed up or slow down seismic waves.
By combining seismic information detected in various locations, researchers can map those structures, much like 3D x-ray scans of the human body.
Upwelling plumes and other giant structures under the oceans are more mysterious, however.
The reason is simple: There are far fewer seismometers on the ocean floor.
Such instruments are expensive because they must be deployed and retrieved by research vessels.
And sometimes they fail to surface after yearlong campaigns.
More recently, scientists have begun to use fiber optic communication cables on the sea floor to detect quakes, but the approach is in its infancy.
MERMAIDs are a cheap alternative.
They drift at a depth of about 1500 meters, which minimizes background noise and lessens the energy needed for periodic ascents to transmit fresh data.
Whenever a MERMAID's hydrophone picks up a strong sound pulse, its computer evaluates whether that pressure wave likely originated from seafloor shaking.
If so, the MERMAID surfaces within a few hours and sends the seismogram via satellite.
The nine floats released near the Galápagos in 2014 gathered 719 seismograms in 2 years before their batteries ran out.
Background noise, such as wind and rain at the ocean surface, drowned out some of the seismograms.
But 80% were helpful in imaging a mantle plume some 300 kilometers wide and 1900 kilometers deep, the team described in February in Scientific Reports.
The widely dispersed MERMAIDs sharpened the picture, compared with studies done with seismometers on the islands and in South America.
"The paper demonstrates the potential of the methodology, but I think they need to figure out how to beat down the noise a little more," Romanowicz says.
This animation shows every recorded earthquake in sequence as they occurred from January 1, 1901, through December 31, 2000, at a rate of 1 year per second.
The earthquake hypocenters first appear as flashes then remain as colored circles before shrinking with time so as not to obscure subsequent earthquakes.
The size of the circle represents the earthquake magnitude while the color represents its depth within the earth.
At the end of the animation it will first show all quakes in this 100-year period.
Next, it will show only those earthquakes greater than magnitude 6.5, the smallest earthquake size known to make a tsunami.
It will then show only those earthquakes with magnitudes of 8.0 or larger, the “great” earthquakes most likely to pose a tsunami threat when they occur under the ocean or near a coastline and when they are shallow within the earth (less than 100 km or 60 mi. deep).
The animation concludes by showing the plate boundary faults responsible for the majority of all of these earthquakes.
The era of modern earthquake seismology—the scientific study of earthquakes—began in the 20th Century with the invention of the seismometer and its deployment in instrument networks to record and measure earthquakes as they occur.
Therefore, when the animation begins only the largest earthquakes appear as they were the only ones that could be detected at great distances with the few available instruments available at the time.
But as time progresses, more and more seismometers were deployed and smaller and smaller earthquakes could be recorded.
For example, note how in the 1930’s many small earthquakes suddenly seem to appear in California, but this illusion results from the installation of more and more instruments in that region.
Likewise, there appears to be a jump in the number of earthquakes globally in the 1970’s when seismology took another leap forward with advances in telecommunications and signal processing with digital computers, a trend that continues today.
20th Century seismology revealed the global geographic distribution of earthquakes and helped to solidify the Theory of Plate Tectonics.
Notice how earthquake epicenters do not occur randomly in space but form patterns over the earth’s surface, revealing the boundaries between tectonic plates as shown toward the end of this animation.
This time period also includes some remarkable events, including those that generated devastating tsunamis:
8.8 — Ecuador — 31January 1906 8.4 — Kamchatka, Russia — 3 February 1923 8.4 — Sanriku, Japan — 2 March 1933 8.6 — Unimak Island, Aleutian Islands — 1 April 1946 9.0 — Kamchatka, Russia — 4 November 1952 8.6 — Andreanof Islands, Aleutian Islands — 9 March 1957 9.5 — Valdivia, Chile — 22 May 1960 9.2 — Prince William Sound, Alaska — 28 March 1964 8.7 — Rat Islands, Aleutian Islands — 4 February 1965
These earthquakes represent some of the largest ever recorded.
Note how they all occur at a particular type of plate boundary, subduction zones where tectonic plates collide, so these are the regions where we expect future devastating tsunamis to be generated.
This animated map created from the NOAA, NWS, and PTWC shows every recorded earthquake in chronological order from January 1, 2001 to December 31, 2015.
The size of the circle shows the magnitude of the earthquakes in relation to each other.
The color represents the earthquake depth.
The size of the circle shows the magnitude of the earthquakes in relation to each other.
The color represents the earthquake depth.
Since that campaign, the MERMAID design was reworked by research engineer Yann Hello of Geoazur, a geoscience lab in Sophia Antipolis, France.
He made them spherical and stronger, and tripled battery life.
The floats now cost about $40,000, plus about $50 per month to transmit data.
"The MERMAIDs are filling a need for a fairly inexpensive, flexible device" to monitor the oceans, says Martin Mai, a geophysicist at King Abdullah University of Science and Technology in Thuwal, Saudi Arabia.
Between June and September of 2018, 18 of these new MERMAIDs were scattered around Tahiti to explore the Pacific Superswell, an expanse of oddly elevated ocean crust, likely inflated by plumes.
The plan is to illuminate this plumbing and find out whether multiple plumes stem from a single deep source.
"It's a pretty natural target," says Catherine Rychert, a seismologist at the University of Southampton in the United Kingdom.
"You'd need a lot of ocean bottom seismometers, a lot of ships, so having floats out there makes sense."
So far, the MERMAIDs have identified 258 earthquakes, Joel Simon, a graduate student at Princeton, told the EGU meeting.
About 90% of those have also been detected by other seismometers around the world—an indication that the hydrophones are detecting informative earthquakes.
Simon has also identified some shear waves, or S-waves, which arrive after the initial pressure waves of a quake and can provide clues to the mantle's composition and temperature.
"We never set out to get S-waves," he said.
"This is incredible." S-waves can't travel through water, so they are converted to pressure waves at the sea floor, which saps their energy and makes them hard to identify.
In August, 28 more MERMAIDS will join the South Pacific fleet, two dozen of them bought by the Southern University of Science and Technology in Shenzhen, China.
Heiner Igel, a geophysicist at Ludwig Maximilian University in Munich, Germany, cheers the expansion.
"I would say drop them all over the oceans," he says.
Links :
- Priceton University : MERMAIDs reveal secrets from below the ocean floor
- National Geographic : Every three minutes, an earthquake strikes in California / Strange waves rippled around the world, and nobody knows why
- LiveScience : A Single Earthquake Can Move Millions of Tons of Carbon into Earth
- Nature : Earthquake-risk maps pinpoint world’s most vulnerable areas
No comments:
Post a Comment