Cryosat reveals recent Greenland ice loss
Between 2011 and 2014, Greenland lost around one trillion tonnes of ice.
This corresponds to a 0.75 mm contribution to global sea-level rise each year – about twice the average of the preceding two decades.
These results from the UK Centre for Polar Observation and Modelling (CPOM) at the University of Leeds combine data from the CryoSat mission with a regional climate model to map changes in Greenland ice-sheet mass.
source : ESA
From The Guardian by John Abraham
The Greenland Ice Sheet is losing 110 million Olympic size swimming pools worth of water each year.
A new study measures the loss of ice from one of world’s largest ice sheets.
They find an ice loss that has accelerated in the past few years, and their measurements confirm prior estimates.
As humans emit heat-trapping gases, we expect to see changes to the Earth.
One obvious change to be on the lookout for is melting ice.
This includes ice atop mountains, ice floating in cold ocean waters, and the ice within large ice sheets or glaciers.
It is this last type of ice loss that most affects ocean levels because as the water runs into the oceans, it raises sea levels.
This is in contrast to melting sea ice – since it is already floating in ocean waters, its potential to raise ocean levels is very small.
So measuring ice sheet melting is important, not only as a signal of global warming but also because of the sea level impacts.
But how is this melting measured? The ice sheets on Greenland and Antarctica are huge and scientists need enough measurements in space and time to really understand what’s going on.
That is, we need high-resolution and long duration measurements to fully understand trends.
In a very recent publication in the journal Geophysical Research Letters, an international team reported on a new high-resolution measurement of Greenland.
The lead author, Malcolm McMillan from the Centre for Polar Observation and Modeling, and his colleagues mapped Greenland with incredibly high resolution (5 km distances).
They accomplished this mapping by obtaining data from the Cryosat 2 satellite.
This satellite uses a technique called radar altimetry to measure the height of surfaces.
It is able to track the elevation of the ice sheets on Greenland with high precision.
If the height of the ice sheet is growing, it means the ice is getting thicker.
If the heights are decreasing, it means the ice layers are getting thinner.
Watch this documentary on Greenland which icebergs are said to be melting.
A simplistic view would be that if ice sheets become taller, then they contain more frozen water.
If they are shorter, they contain less water.
But, this isn’t the entire story.
Scientists also have to account for other changes, such as changes to density, surface roughness, and water content.
When you realize that the Greenland Ice Sheet is thousands of meters thick, and the top layers include both snow and firn (which later get buried and compressed into ice), it becomes apparent that accounting for the constitution of the ice sheet is important when estimating how much water is being delivered to the ocean.
The authors of this study did such an accounting and they discovered that not only is Greenland losing a lot of ice, but the loss varies a lot depending on location and year.
For example, 2012 was a year of incredible ice loss compared to other years.
Also, the western side of the ice sheet is losing much more ice than the eastern side.
They also found that a small part of the ice sheet (less than 1% of the sheet) is responsible for more than 10% of the mass loss.
Why are scientists out flying over Greenland, drilling into its ice, and monitoring it from space?
The answer is that they see it as a bellwether of future Earth.
In total, they estimate approximately 270 gigatons of ice loss per year for 2011–2014.
This result is almost a perfect match to independent measurements made by other researchers and builds our confidence in their conclusions.
To put this in perspective, the Greenland Ice Sheet is losing approximately 110 million Olympic size swimming pools worth of water each year.
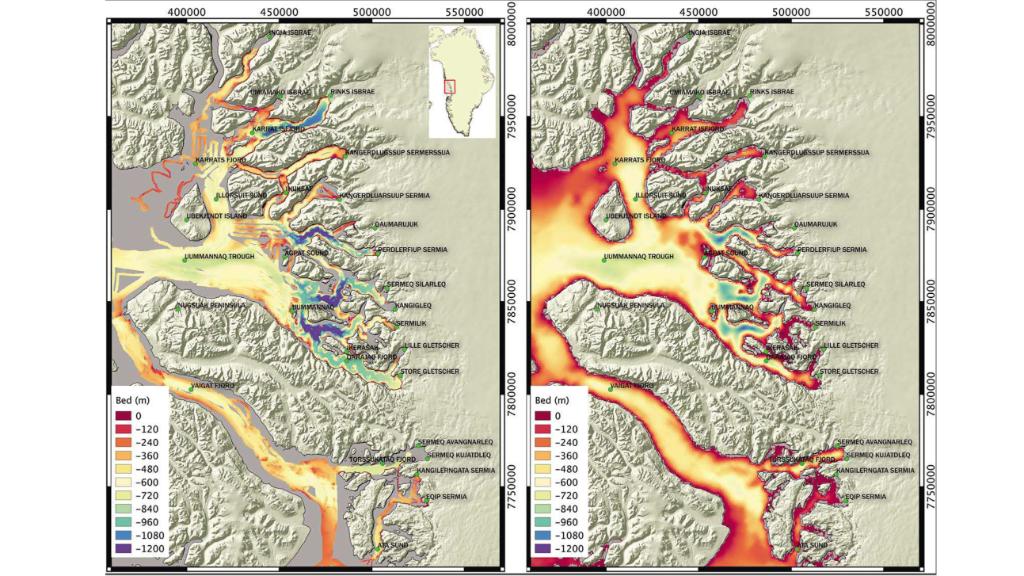
New maps chart-Greenland glaciers melting risk
 NASA : First Map Of Thawed Areas Under Greenland Ice Sheet

Lead author Malcolm told me:
"Using high resolution satellite data from ESA’s CryoSat-2 mission, we have produced a detailed and comprehensive picture of how Greenland has changed in recent years.
In particular, we have been able to map the changing ice sheet in fine detail, and pinpoint where, and when, the greatest ice losses have occurred.
These observations reveal not only the extent of Greenland’s contribution to sea level in recent years but, thanks to their high resolution, allow us to identify the key glaciers that are showing the greatest signs of change.
The data also enable us to look at how much ice has been lost in each year and, for example, to quantify the large impact on the ice sheet of the record summertime temperatures occurring in 2012.
Within a wider context, satellite records such as these are crucial for systematically monitoring our climate system, and assessing the impact of rising temperatures across Earth’s polar regions.
In particular, they help us to understand the sensitivity of the ice sheet to changes in its surrounding atmosphere and ocean environment, and aid the development of reliable sea level rise projections."
The duration of this study is pretty short (4 years).
I will be very interested to see if the mass loss continues at the same rate in following years.
If the rate of mass loss increases, it may signify a larger future contribution to sea level from Greenland.
This would be bad news for vulnerable coastal cities like Miami and certainly something coastal areas should plan for.
Links :
- WashingtonPost : Greenland’s ice sheet is in danger. Here’s what we’re seeing on the frozen landscape.
- DTU : Mass loss of Greenland and Antarctica from GRACE, IceSat and CryoSat
- A high-resolution record of Greenland mass balance
- YouTube : NASA | Measuring Elevation Changes on the Greenland Ice Sheet / NASA | Greenland's Ice Layers Mapped in 3D
- NASA : The new Arctic
- John Eglander : Greenland is getting greener
No comments:
Post a Comment